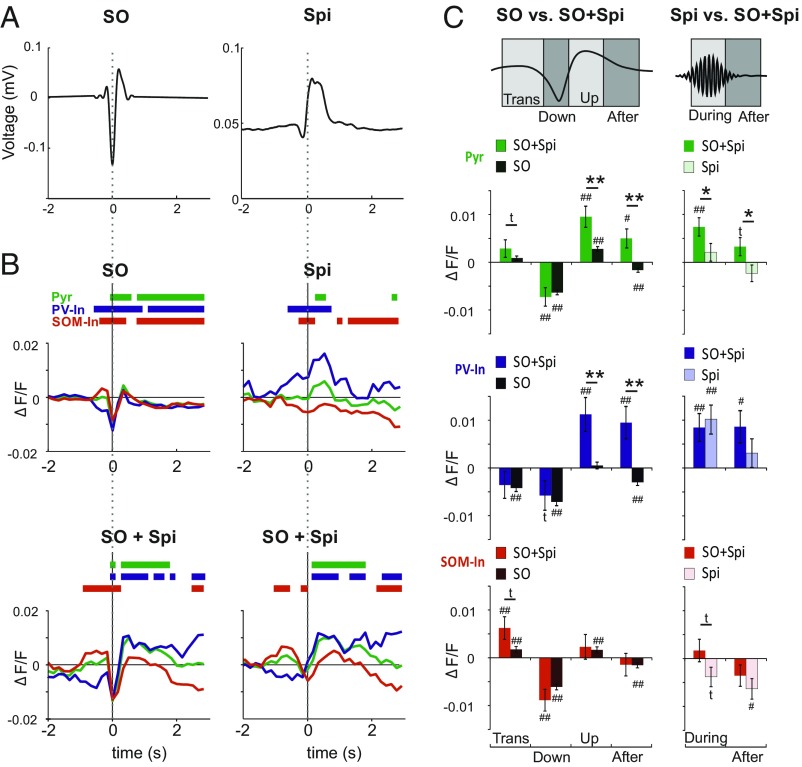
Fig. 2.
Distinct modulation of calcium activity during slow oscillation and spindle. (A, Left) Grand average (across all events from all animals) of the EEG signal (filtered between 0.1 and 4 Hz) during slow oscillation(s) (SO) time-locked to the negative SO half-wave peak (0 s). (A, Right) Grand average of the rms of EEG spindle (Spi) signal (7–15 Hz) time-locked to Spi onset (0 s). (B) Mean ΔF/F signals for putative Pyr cells (green), PV-Ins (blue), and SOM-Ins (red) during solitary SO (Top Left) and solitary Spi (Top Right) and during SO co-occurring with Spi (SO + Spi), time-locked to a negative SO half-wave peak (Bottom Left) and to Spi onset (Bottom Right). Bars on top indicate significance (P < 0.05) with reference to a baseline (−3 to −2 s) set to zero. Average traces across all events from all animals are indicated. (C, Left) Comparison of mean (±SEM) ΔF/F signals between solitary SO and SO + Spi events for the positive-to-negative transition phase (Trans; −0.32 to −0.00 s, with reference to the SO negative half-wave peak = 0 s), the down phase (−0.00 to 0.16 s), the up phase (0.32–0.48 s), and the following after phase (0.54–3 s). (C, Right) Comparisons between mean (±SEM) ΔF/F signals between solitary Spi and SO + Spi events for the phase during the acute Spi (0–1 s with reference to Spi onset set to 0 s) and the after phase (1–3 s). **P < 0.01, *P < 0.05, and tP < 0.1 for pairwise comparisons between solitary events and SO + Spi events respectively. ##P < 0.01, #P < 0.05, and tP < 0.1 for difference from baseline activity (−3 to −2 s).

