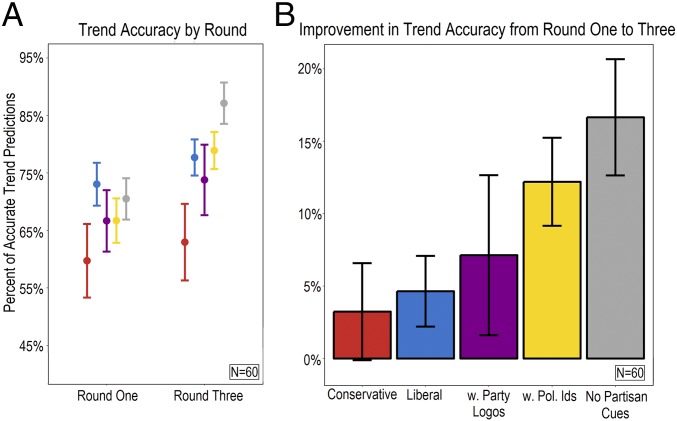
Fig. 3.
Changes in average trend accuracy across experimental conditions. (A) Round 1 and round 3 estimates from all 12 experimental trials, where each trial provides one observation for each condition. All conditions are independent. The error bars show 95% confidence intervals. (B) Bars display the improvement in accuracy from round 1 to round 3, in percentage points. Ids, identities; Pol., political; w., with.

