Fig. 2.
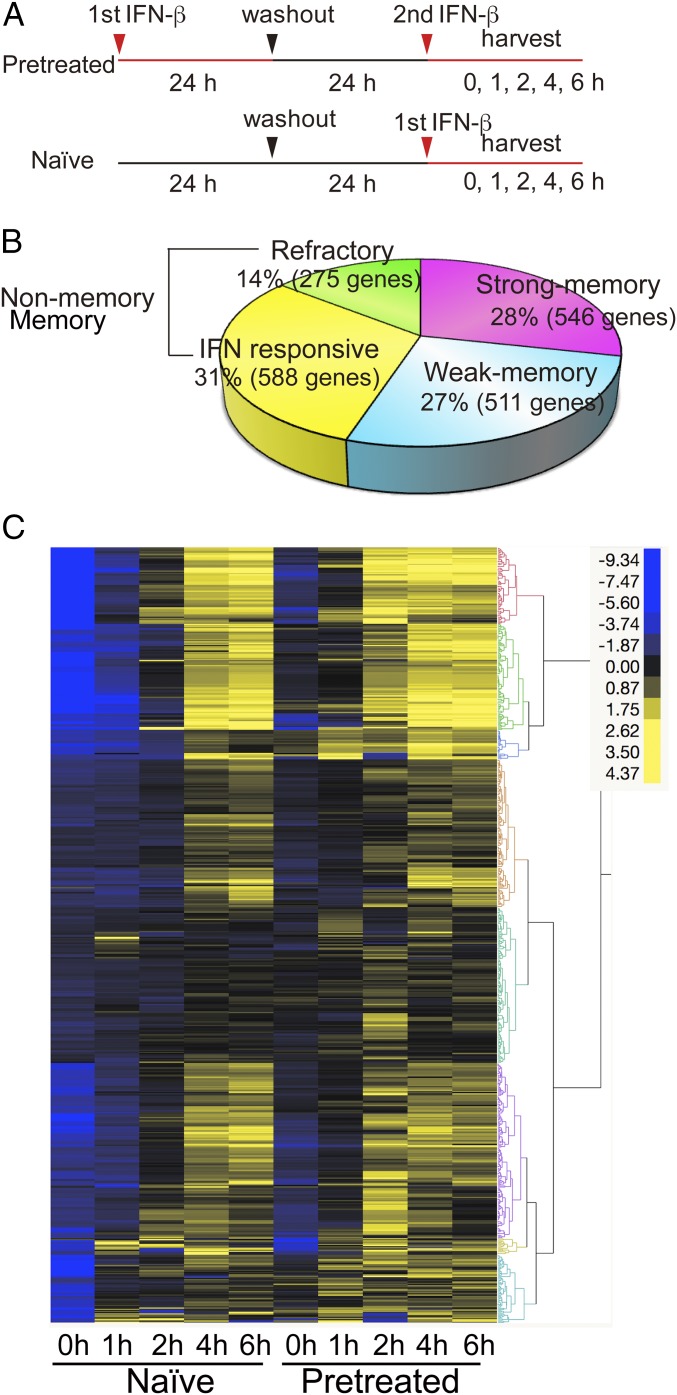
Memory response in selective RNA-seq analysis. (A) Experimental design for RNA-seq. Naïve and pretreated cells were stimulated with IFN for 0, 1, 2, 4, and 6 h. ISGs were defined by those genes showing >2-fold higher transcript expression (RPKM) at any time point during 6 h of IFN treatment in naïve cells. (B) Total memory ISGs (1,057) were subdivided into two groups. Strong memory: ISG mRNA levels were >2-fold higher in pretreated cells than naïve cells (>2 in RPKM). Weak memory: ISG mRNA levels were >1.5-fold higher (>1.5 in RPKM), but <2-fold (<2 in RPKM). Nonmemory ISGs were those with similar expression levels in naïve and pretreated cells [difference <1.5-fold (<1.5 in RPKM)]. Refractory ISGs showed >1.5-fold lower levels of expression in pretreated cells than naïve cells (>1.5 in RPKM). See qRT-PCR examples in SI Appendix, Fig. S2C, GO analysis in SI Appendix, Fig. S2D. Strong memory ISGs and nonmemory ISGs were subjected to further analysis. List of memory, nonmemory, and refractory ISGs is in Dataset S1. (C) Hierarchical clustering analysis for memory ISGs (strong) was performed by the Ward’s minimum variance method using JMP software (SAS Institute). ISG expression levels are depicted by differential coloring. The clustering analysis was done by using Ward’s minimum variance method for unsupervised hierarchical clustering.

