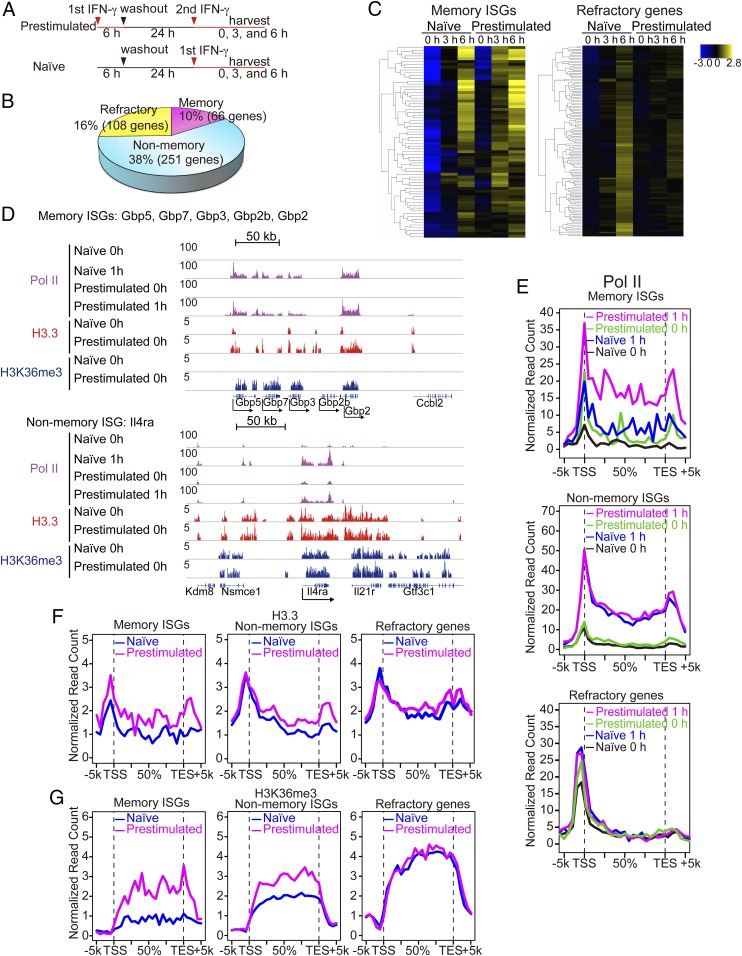
Fig. 5.
IFNγ stimulation generates transcriptional memory in macrophages. (A) Experimental design for microarray analysis. (B) ISGs were defined as those genes expressed at least twofold higher in naïve macrophages treated with IFNγ for 3 or 6 h than untreated macrophages (P < 0.05). ISGs were classified into three groups. Memory ISGs: showing at least 1.5-fold higher in expression (>1.5) in prestimulated macrophages than naïve cells. Nonmemory ISGs: showing less than 1.2-fold (<1.2) difference between naïve and prestimulated macrophages. Refractory ISGs: showing at least 1.5-fold less (<1.5) expression in prestimulated macrophages with IFNγ for 3 or 6 h. List of memory, nonmemory, and refractory ISGs is in Dataset S2. (C) Hierarchical clustering of memory (Left) and refractory ISGs (Right). Memory ISGs exhibited faster and/or greater ISG induction in prestimulated macrophages than naïve cells. Refractory ISGs failed to express or showed reduced ISG expression in prestimulated macrophages. (D) IGV images of Pol II, H3.3, and H3K36me3 distribution over the Gbp gene cluster (memory ISGs) and Il4ra (nonmemory ISG). (E) Global Pol II distribution was analyzed for naïve and prestimulated macrophages at 0 h or 1 h after IFNγ stimulation. Distribution of H3.3 and H3K36me3 was tested for untreated naïve and memory macrophages (24 h after IFN washout). (F and G) Global distribution of H3.3 (F) and H3K36me3 (G) over memory ISGs, nonmemory ISGs, or refractory ISGs in naïve and prestimulated macrophages.

