Fig. 4.
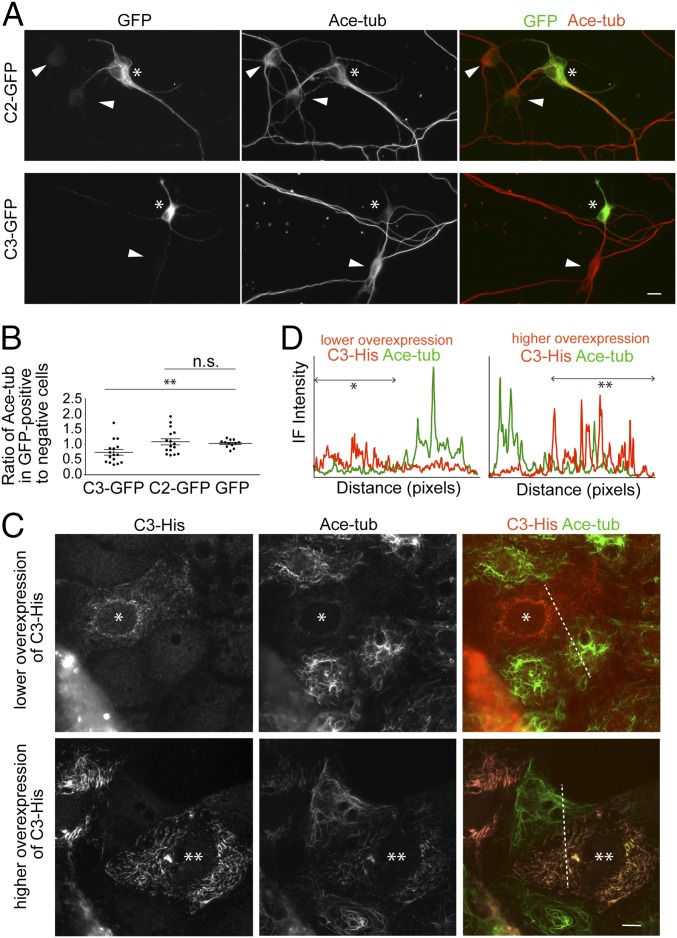
Effects of CAMSAPs overexpression on tubulin acetylation. (A and B) Neurons were transfected with GFP-tagged CAMSAP2 (C2-GFP), CAMSAP3 (C2-GFP), or GFP alone at DIV1, and fixed at DIV5, followed by double-immunostaining for GFP and acetylated tubulin (A). Asterisk indicates a neuron expressing C2-GFP or C3-GFP. For comparison, nontransfected cells are also indicated (arrowheads). The graph in B shows the ratio of immunofluorescence (IF) signals for acetylated tubulin in cells expressing C3-GFP, C2-GFP, or GFP alone to those in cells not expressing the constructs, which are present in the same cultures. For this quantification, average IF intensity for acetylated tubulin was measured at the cytoplasmic region of neuronal cell body, using 16 (for C3-GFP and C2-GFP) and 12 (for GFP) cultures obtained from three independent experiments. **P < 0.005 versus GFP alone. n.s. is not significant. (C and D) Caco2 cells were transfected with C3-His and then double-immunostained for His tag and acetylated tubulin (C). Single asterisk indicates a cell expressing a lower level of His-C3, whereas double asterisks indicate a cell expressing a higher level of His-C3. IF signals were scanned along the dotted lines, as shown in D. Lower His-C3 expression eliminated acetylated microtubules, whereas higher His-C3 expression rearranged their assembly. A representative image from more than 60 transfected cells obtained from three independent experiments is shown. (Scale bars, 10 μm.)

