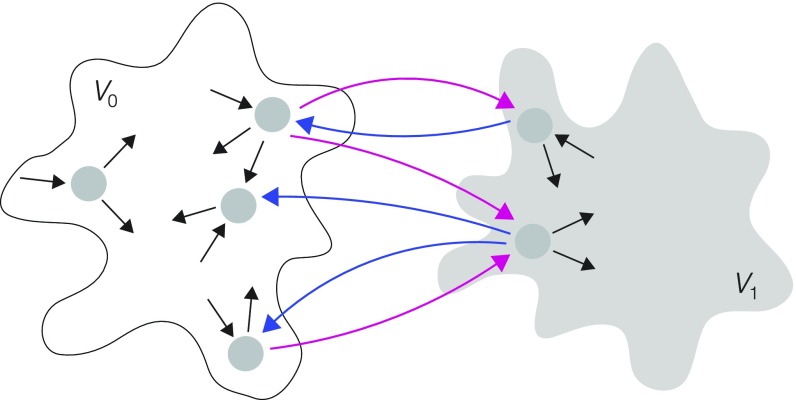
Fig. 2.
Partitions and splitting. A partition is shown schematically, with a graph made up of two disjoint subgraphs, (white) and (gray), whose individual structures can be arbitrary, as suggested by the “cloud” outlines, with magenta edges splitting from , blue edges splitting from , and labels omitted for clarity.

