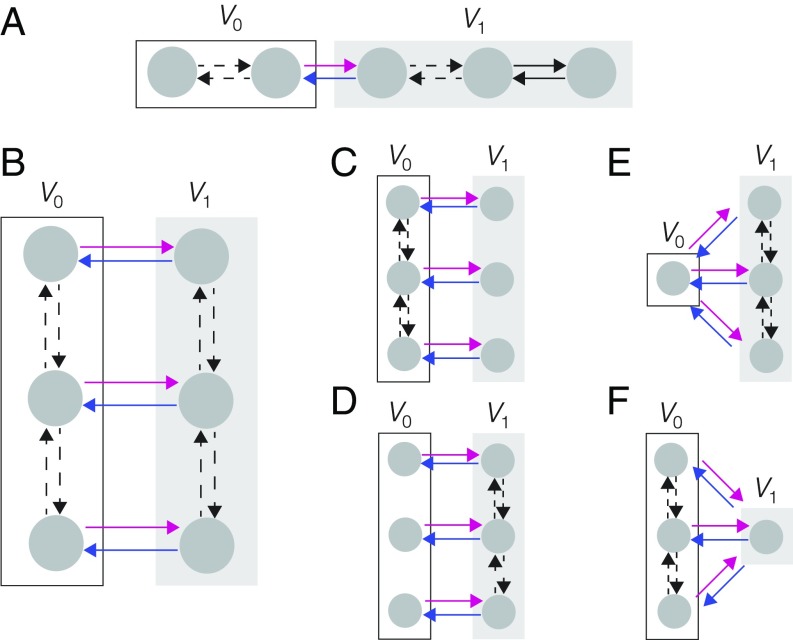
Fig. 3.
Graph structures for application examples, showing partitions into (white box) and (gray box), with the splitting edges in magenta and blue and labels omitted for clarity. In the applications cited in the text, the input variable occurs to degree 1 in the labels on magenta edges and nowhere else, although our results offer greater generality. Dashed edges indicate potential intervening vertices. (A) A sequence graph, as used in refs. 8, 16, and 52, to which Proposition 1 applies. (B) Parallel sequences provide a model of single-molecule enzyme kinetics, as explained in the text and used in refs. 7 and 11–14. If thermodynamic equilibrium is assumed, Proposition 1 applies. Away from equilibrium, additional parametric assumptions give rise to the graphs shown in C–F (SI Appendix, Table S1 and Fig. S2.) Proposition 2 applies to C and D, Proposition 3 applies to E, and Proposition 4 applies to F.

