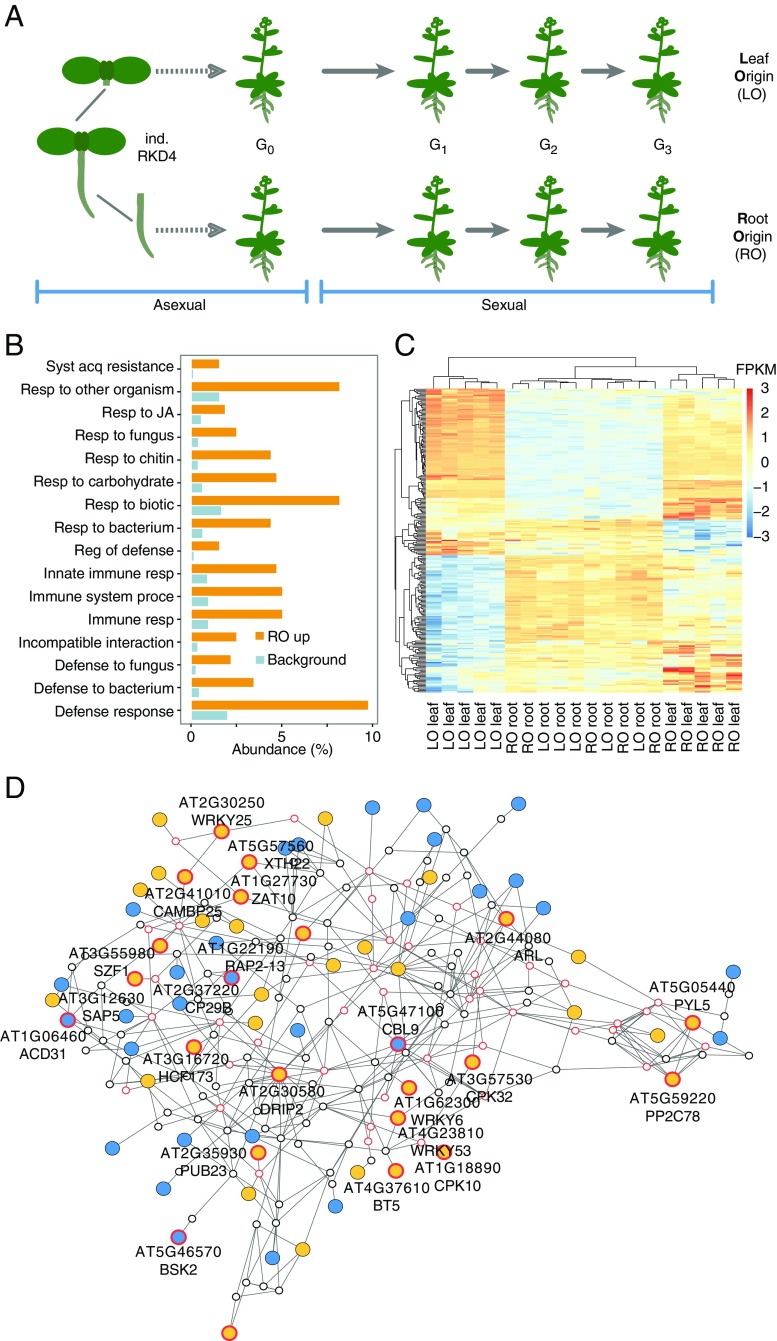
Fig. 1.
Differential expression of defense-related genes in RO and LO plants. (A) Experimental design. RO and LO regenerated plants (n = 5 independent lines each) were propagated through self-fertilization over three generations. (B) GO analysis of DEGs (FDR <0.01; absolute log-twofold change >1.5) between leaves of RO and LO G2 plants revealing enrichment for defense-related functions. (C) Heatmap of scaled, normalized log-transformed read counts for genes underlying the significant enrichment of GO terms in B. FPKM, fragments per kilobase per million. (D) Interaction gene network of DEGs. To facilitate network analysis, we lowered the FDR threshold to <0.05. Of the resulting 4,585 DEGs, 2,752 were represented in the ANAP protein interaction database. Nodes represent genes; triangles highlight defense-related genes from B; edges indicate evidence for gene interaction. Blue filled circles, high expression in LO plants; orange filled circles, high expression in RO plants; red outlined circles, genes with stress-related GO terms.

