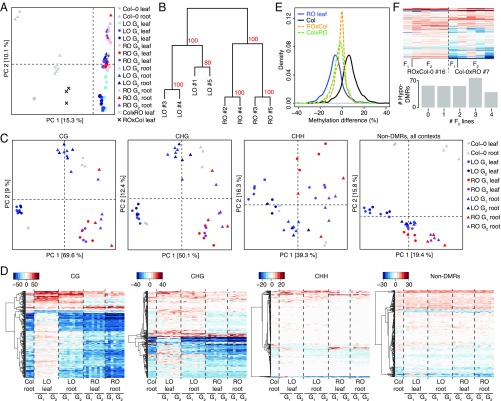
Fig. 3.
DNA methylation variation in regenerated plants is stably inherited after selfing and back-crossing. (A) PCA of DNA methylation levels at DMPs identified from pairwise sample comparisons. Numbers in brackets indicate the fraction of overall variance explained by the respective PC. (B) Clustering of LO and RO leaf samples in generation G2, based on 765 DMRs identified in all-against-all pairwise comparisons. (C) PCA of methylation at 255 DMRs identified in G2 RO vs. LO leaf comparison, divided by cytosine sequence context. (Right) PCA on methylation in all contexts within randomly chosen non-DMRs. Numbers in brackets indicate the amount of variance explained by the respective PC. (D) Gains and losses of DNA methylation in DMRs identified between RO and LO leaves in the G2 generation. Color keys indicate methylation rate differences in relation to leaves of nonregenerated plants. (Right) Differences in a random subset of non-DMRs. (E) Methylation frequencies at DMRs in leaves of nonregenerated Col-0, RO, and reciprocal crosses (F1) between nonregenerated Col-0 and RO plants. (F) Methylation analysis of progeny from F1 reciprocal hybrids. The heatmap shows DMR methylation levels in individual F1 hybrid plants (#7 and #16) and each of four independent descendants. The bar plot shows the frequency of hypomethylation in F2 plants of DMRs that were hypomethylated in the F1 hybrid.

