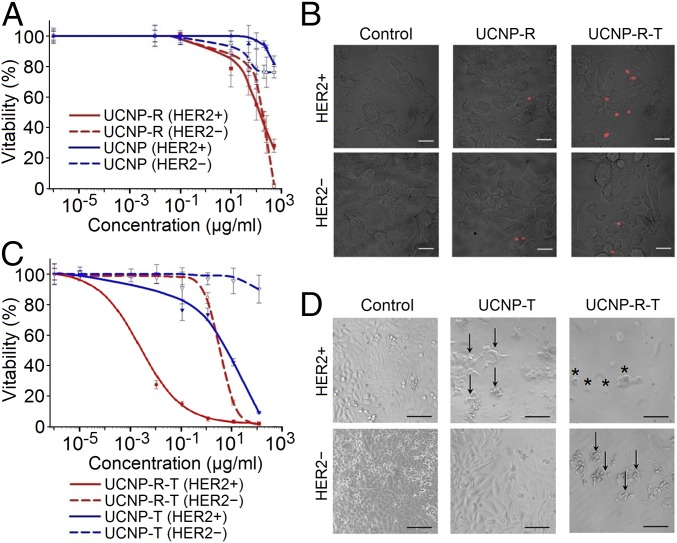
Fig. 3.
Interaction of UCNP-R-T with eukaryotic cells. HER2+ denotes SK-BR-3 cells expressing HER2 receptors. HER2− denotes CHO cells lacking HER2 receptors. (A) Viability of HER2+ and HER2− cells versus the concentration of UCNP-R and UCNP. (B) An overlay of bright-field and fluorescence LSCM images showing specific binding of UCNP-R-T to the surface of HER2+ cells in contrast to little labeling of HER2− cells after 1-h incubation with nanocomplexes at 4 °C. The fluorescence LSCM images were acquired using excitation/emission at 980 nm/769–849 nm. (Scale bars: 20 μm.) (C) Viability of HER2+ and HER2− cells versus the concentration of UCNP-R-T and UCNP-T. (D) Effects of UCNP-R-T and UCNP-T on the cell morphology. The images were obtained after 96-h incubation with UCNP-R-T/UCNP-T at the concentration of 25 μg/mL. The absorbed dose (in case of UCNP-R-T) was 3.44 Gy per plate well. Arrows indicate detached and shape-changed cells. Asterisks indicate dead cells. (Scale bars: 100 μm.)

