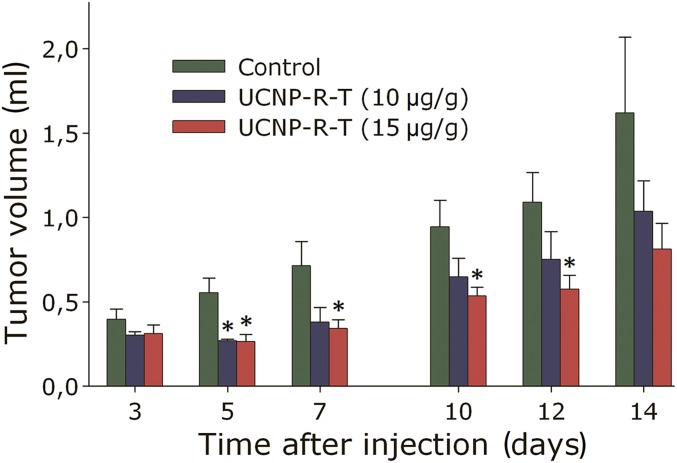
Fig. 4.
Therapeutic effect of UCNP-R-T. Dynamics of the tumor volume in mice upon treatment with UCNP-R-T at doses of 10 and 15 μg/g. The tumor node volume is normalized to that measured on day 0 (day of UCNP-R-T administration). The data are presented as mean ± SEM. * denotes statistically significant difference from the control (P < 0.05), according to t test with Bonferroni correction, n = 5–10.

