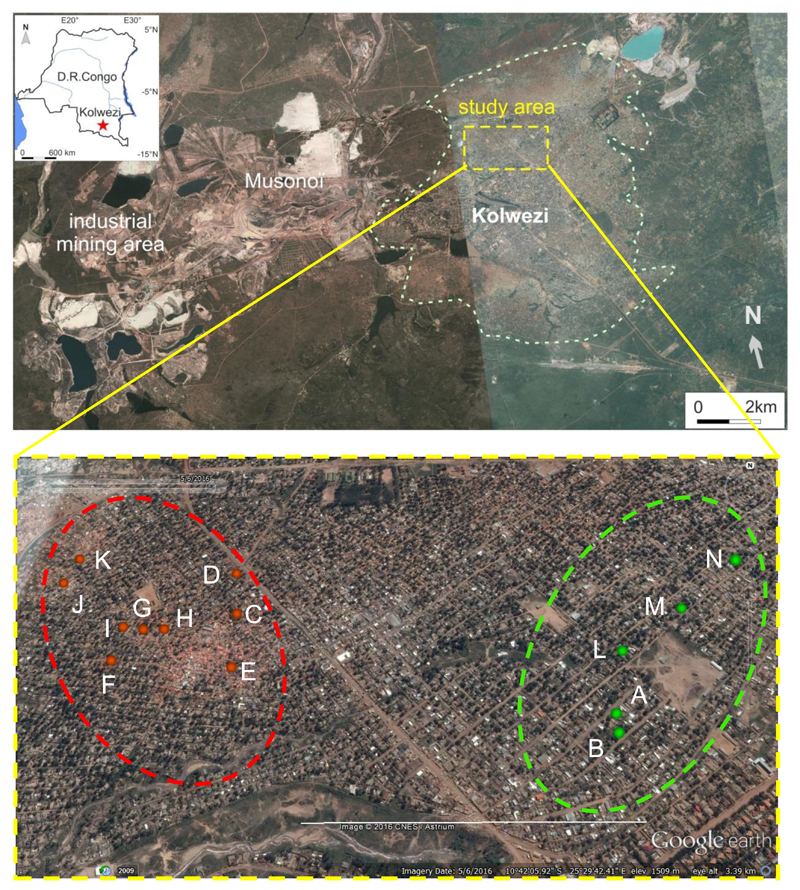
Figure 1. Satellite images of Kolwezi and the study area.
Upper panel: satellite image (Google Earth) of the Kolwezi area with its urban residential zone (within white dashed line) and the zone of industrial mining to the West of the town. The study area (within yellow dashed line) is shown in detail in the lower panel.
Lower panel: study area showing the chosen control area without mining activities (on the right circled by a green dashed line) and the approximate area affected by artisanal mining (on the left circled by a red dashed line). The red and green dots with letters A to N indicate the 14 plots where participants were recruited. Zones of reddish coloration within the mining area are due to orange plastic sheeting used for sheltering or covering mine pits (Imagery date is 5/6/2016). The white horizontal line corresponds to 1000 m.

