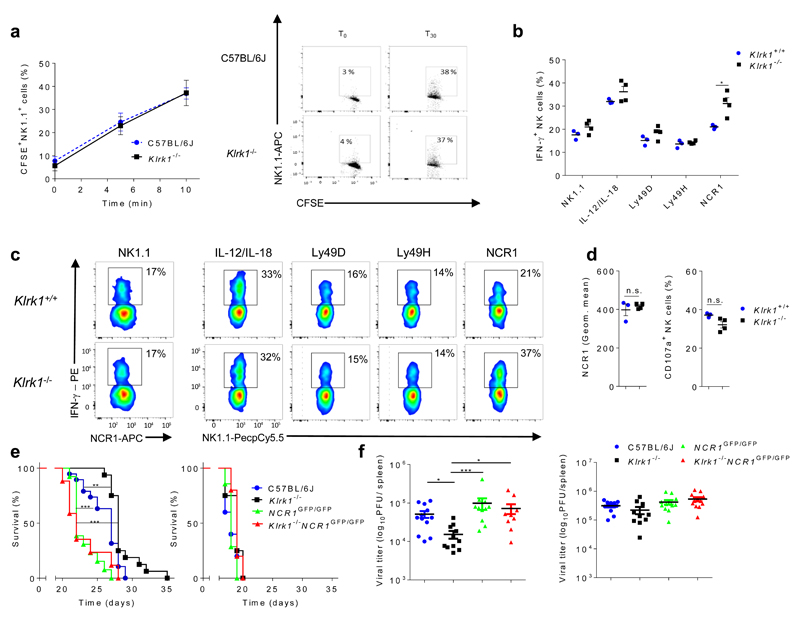
Figure 2. Klrk1-/- NK cells show specific hyper-reactivity through NCR1 receptor.
(a) Representative graph (left) and dot plots (right) from three independent experiments showing formation of conjugates between labeled NK and B16 cells (mean ± s.e.m; n=5 mice per group). (b) IFN-γ production by NK cells from Klrk1+/+ (n=3) or Klrk1-/- (n=4) mice after stimulation by monoclonal antibodies (mAb) through indicated receptors or with IL-12/IL-18 cytokines. (c) Representative FACS plots gated for CD3-NCR1+ cells (NK1.1 stimulation) or CD3-NK1.1+ cells (other stimuli). (d) Levels of NCR1 expression from untreated (left) and percentage of CD107a+ (right) NK cells, after 4h of NCR1 stimulation using mAb, from Klrk1+/+ (n=3) or Klrk1-/- (n=4) mice. (e) Survival curves for untreated (left) or NK cell depleted (right) indicated groups of mice after B16 i.v. injections (n=10 mice per group). Representative graph from three independent experiments. (f) Viral titers in spleens 4 days after infection of indicated group of mice with 5x 10⁵ PFU Δm157 MCMV. Mice were left untreated (left) or received NK cell depleting antibodies one day prior to infection (right). Graphs show pooled data from two independent experiments. Survival curves were analyzed by the Kaplan–Meier model followed by Log-rank (Mantel-Cox) test (two-tailed; **p < 0.01, *** p <0.001). a, b and d are analyzed using two-tailed unpaired t-test (shown mean ± s.e.m; ns, not significant, *p < 0.05). Viral titers were analyzed using Kruskal-Wallis test (shown mean ± s.e.m; *P< 0.05; ***P< 0.001). b-d show representative data from 2 independent experiments using littermates.

