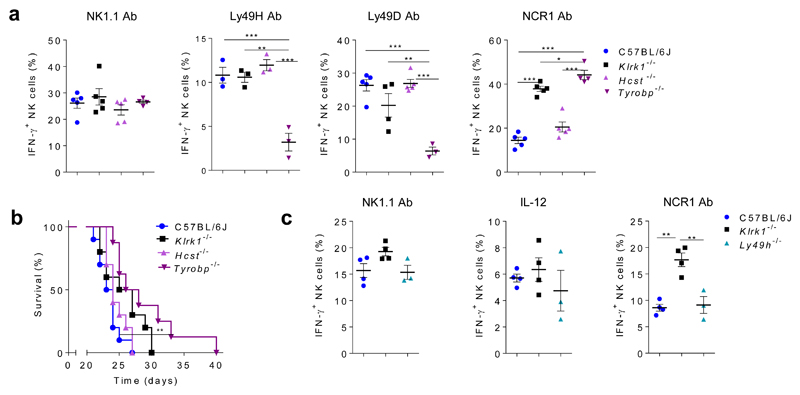
Figure 4. The NKG2D-DAP12 signaling axis regulates NCR1 activity.
(a) NK cells from Tyrobp-/-(n=3 or 4 mice), Hcst-/-(n=3 or 5 mice), Klrk1-/- (n=3 or 5 mice) and C57BL/6J (n=3 or 5) mice were stimulated for 4h through the NK1.1, Ly49H, Ly49D or NCR1 receptor by mAb and IFN-γ production was analyzed after 4h. (b) Survival curves of indicated group of mice after i.v. injection of B16 cells (Kaplan–Meier model followed by Log-rank (Mantel-Cox) test; n=10 mice per group). (c) NK cells from Ly49h-/- (n=3 mice), Klrk1-/- (n= 4 mice) and C57BL/6J (n= 4 mice) mice were stimulated through the NK1.1 or NCR1 receptor by mAb or with IL-12 cytokines and IFN-γ production was analyzed after 4h. Shown are representative plots of three (a) or two (b-c) experiments. For analysis of a and c ANOVA, with Bonferroni's post-test correction for multiple comparisons was used. Shown are means ± s.e.m. * P<0.05, ** P<0.01, *** P < 0.001.

