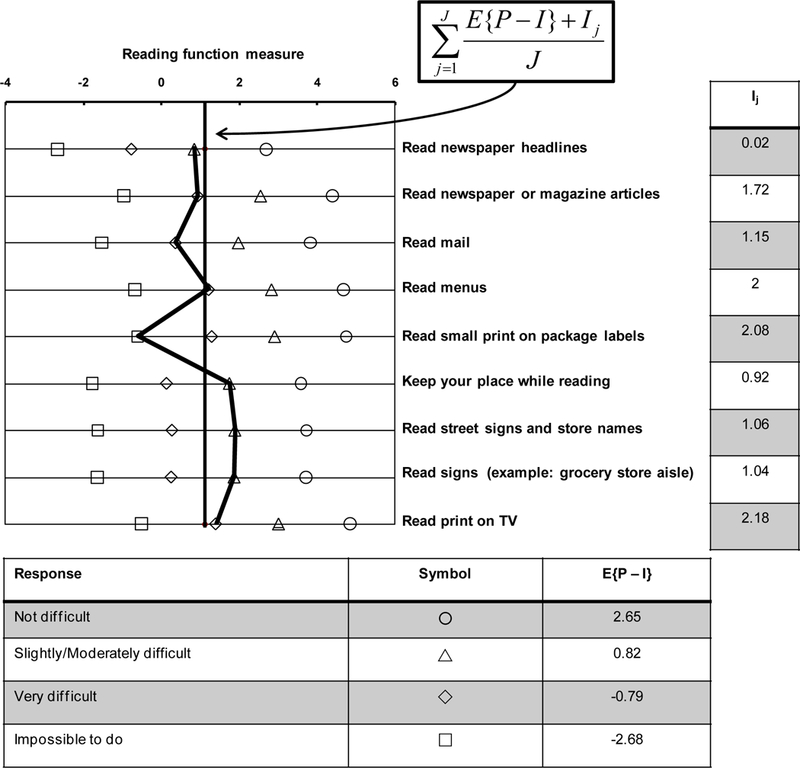
Figure 1.

Keyform plot of pre-intervention baseline responses to reading items in the VA LV VFQ by a participant in LOVIT. Reading function person measure is plotted on the horizontal axis at the top of the figure. Each of the four difficulty ratings is represented by a different symbol identified in the table at the bottom of the figure. That table also lists average functional reserve for each response category. Each row in the figure corresponds to a different reading item identified by the item labels on the right of the figure. The item measures are listed in the table to the right of the item descriptions. The response symbols are positioned on the horizontal axis according to the sum of functional reserve and the item measure. The participant’s responses to the reading items are connected by the solid black lines. The solid vertical line corresponds to the average of the sums of average functional reserve and the item measures, which mathematically is an estimate of the person measure.
