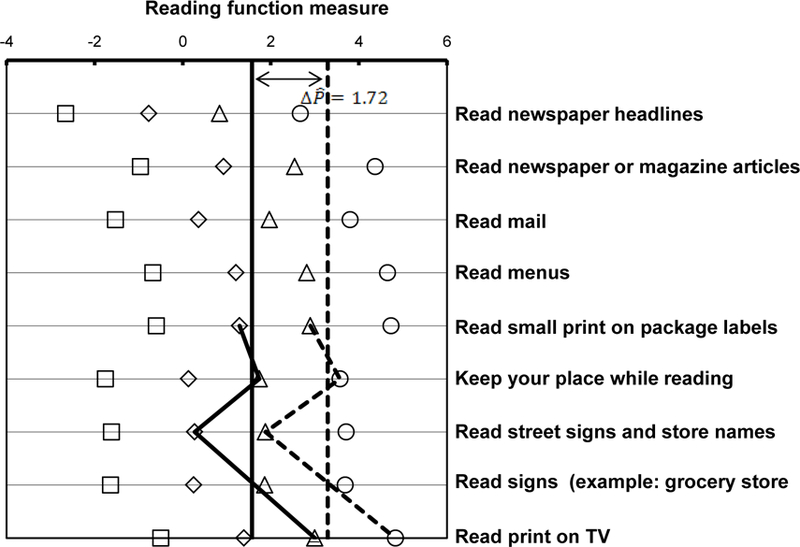
Figure 7.

Keyform plot of the same baseline (solid lines) and follow-up responses (dashed lines) to VA LV VFQ reading items that are plotted in Figure 6, except that the items for which responses at baseline were “not difficult” are removed. The solid vertical line is the average person measure estimate from pre-intervention baseline responses to the four retained items and the dashed vertical line is the average person measure estimate from post-intervention follow-up responses to the same four retained items. By filtering out the items that were rated “not difficult” at baseline, the estimated change in person measure increased to ΔP = 1.72.
