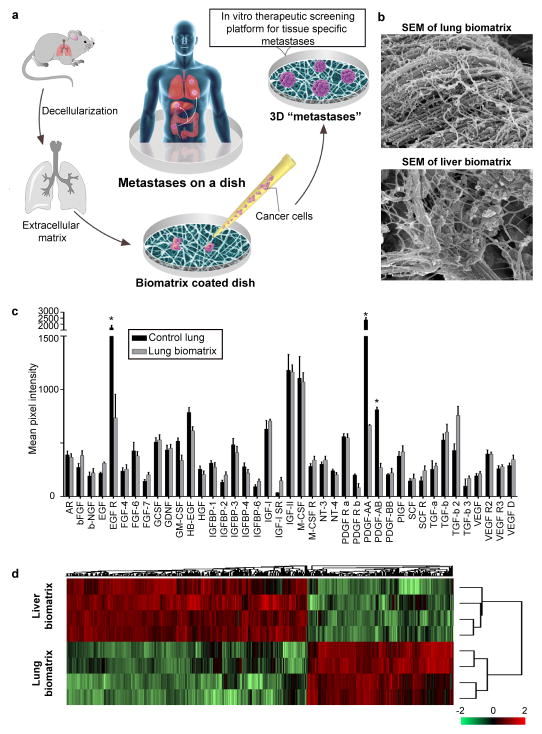
Figure 1.
BMSs recapitulate tissue-specific microenvironments found in vivo. (a) Schematic depicting methodology used for studying metastatic disease in vitro. (b) Scanning electron micrographs of lung and liver BMSs. Scale bars, 100 nm. (c) Analysis of growth factors and cytokines present in lung tissues before and after decellularization (n = 4 biologically independent decellularized samples from four different rats). Differences in the relative abundance of signaling molecules were determined using multiple t-tests, two-sided. Data represent mean ± S.E.M.; statistical significance determined using the Holm-Sidak method, with alpha = 0.05. * p < 0.05 (p = 0.001, 0.00011, and 0.00015 for EGF R, PDGF-AA, and PDGF-AB, respectively); (d) Heat map comparing the composition and relative abundance of proteins present in liver and lung BMSs (n = 4 biologically independent samples). Hierarchical clustering was performed using z-score normalized label-free quantification intensities.

