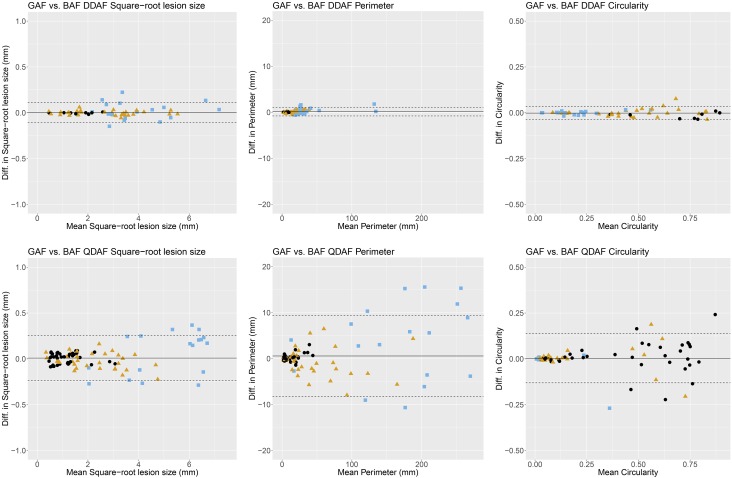
Figure 2.
Intermodality agreement. The Bland-Altman plots demonstrate the intermodality agreement of both AF modalities (GAF versus BAF) concerning DDAF (top) as well as QDAF (bottom) square-root lesion size (left), perimeter (middle), and circularity (right) separated for ERG-based group classification38 (group 1, black dots; group 2, yellow triangles; group 3, blue squares). The solid line indicates the mean difference and the dashed lines indicate the 95% limits of agreement. Overall, GAF- and BAF-based gradings showed similar results. However, DDAF measurements revealed higher levels of agreement compared to QDAF.

