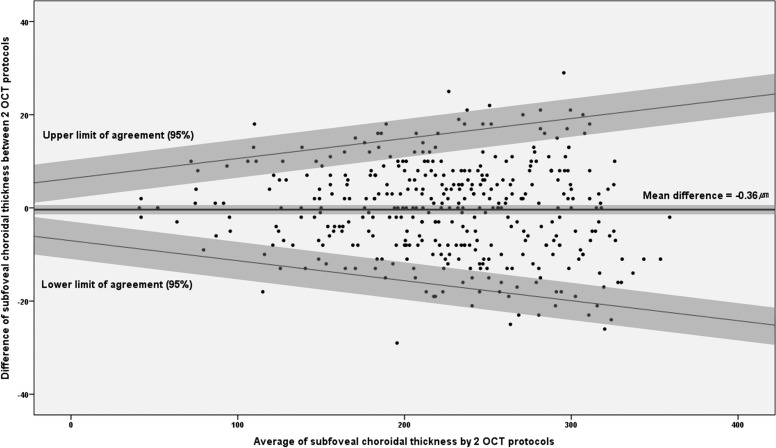
Figure 5.
Bland-Altman plots of the difference by the two OCT scan protocols (conventional versus EDI scan) in SFCT measurement of 378 eyes. Shaded regions represent the CIs on the mean bias and LOA. The 95% CIs of the mean bias were (−1.386, 0.664). The 95% upper and lower LOAs were Y = (0.021X + 3.409) × (±1.96) − 0.360. The 95% CIs of upper and lower LOA were Y = (0.021X + 3.409 ± 1.095 × 1.96) × 1.96 − 0.360 and Y = (0.021X + 3.409 ± 1.095 × 1.96) × (−1.96) − 0.360, respectively.

