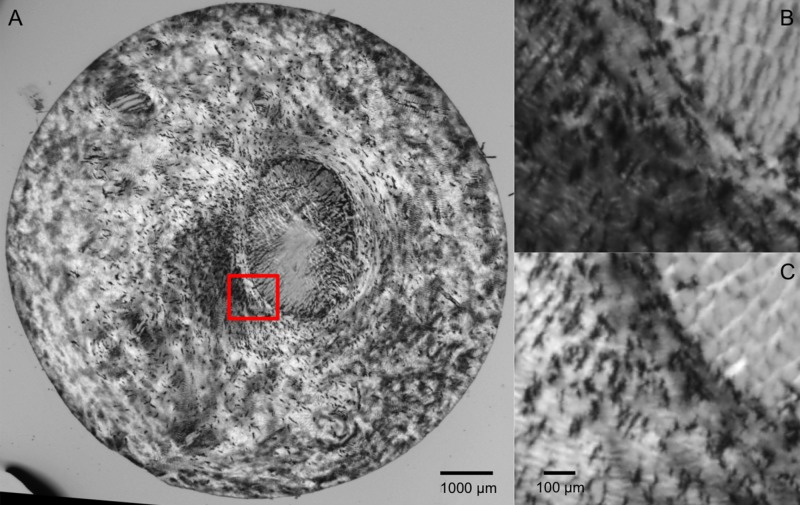
Figure 1.
Example “raw” PLM of the posterior pole of a pig eye. (A) Full section view illustrating the variations in image intensity for differently oriented collagen fibers. (B, C) Close-up of the canal edge (red box in A), illustrating the changes in intensity due to polarizer orientations 45° apart.

