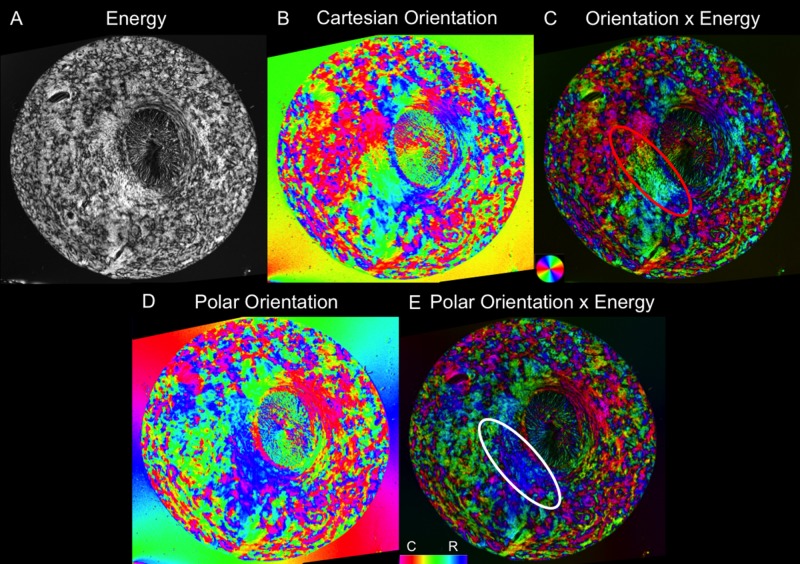
Figure 2.
Example visualization of fiber orientation from a single section in a pig eye. (A) An “energy” parameter proportional to the signal information at each pixel helps distinguish the tissue from the background. (B) Cartesian orientation map. (C) Combining the energy and Cartesian orientation maps for visualization helps discern tissue architecture. (D) Polar orientation map. (E) Combined energy and polar orientation map. The polar orientation allows for the radial and circumferential fibers to be more easily distinguished. Whereas in Cartesian coordinates, these fibers display a spectrum of colors, as seen by the radials in the red oval, in polar coordinates, they each have a more limited set of colors, as seen in the white oval.

