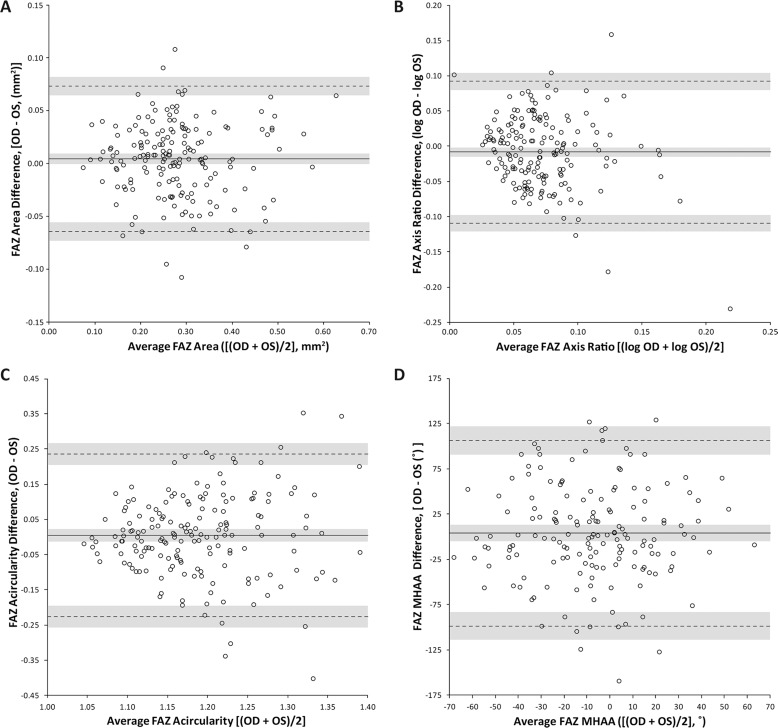
Figure 2.
Interocular symmetry of FAZ metrics. Data are expressed in Bland-Altman plots to show interocular differences for (A) area, (B) axis ratio, (C) acircularity, and (D) MHAA. Solid lines represent average difference (bias) between the eyes, while dotted lines represent limits of agreement (LOA). The gray shading represents the confidence intervals for the bias and LOAs for each metric.

