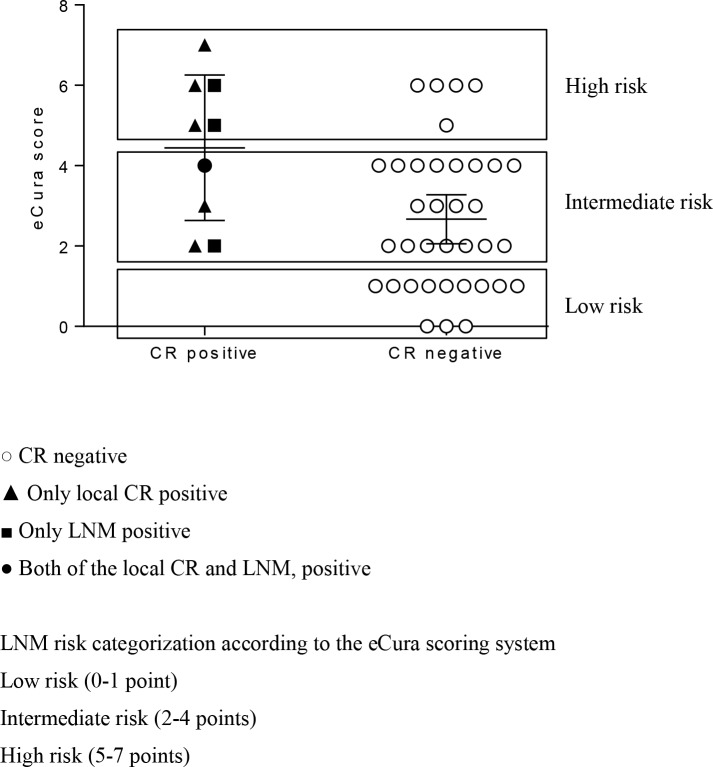
Fig 1. Relationship between eCura scores and CR status.
Each symbol represents 1 patient. The long and short vertical bars represent the mean and mean ± standard deviation, respectively. According to the eCura risk scoring system, CR positivity rates were 0% (0/12), 17% (4/23), and 50% (5/10) in the low-risk group, intermediate-risk group, and high-risk group, respectively.

