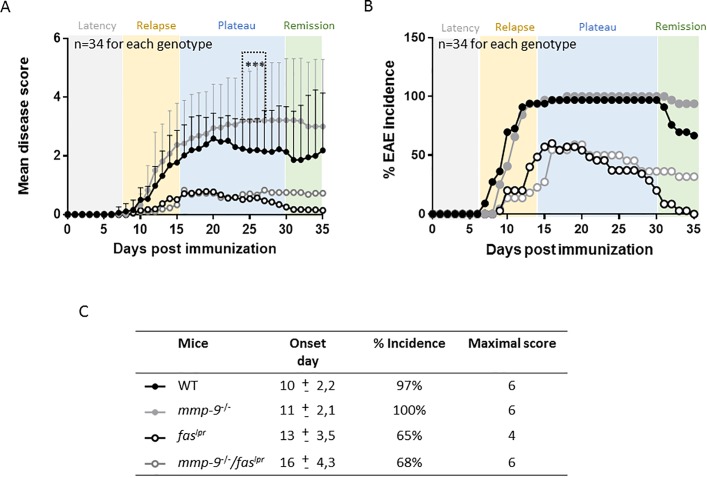
Fig 1.
Clinical evolution of EAE in WT, mmp-9-/-, faslpr and mmp-9-/-/faslpr on short-term. EAE was induced in the four mouse strains and disease scores were measured during 35 days. (A) Mean disease scores from 34 mice for each of the four mouse strains. Significant differences in the comparison between WT and mmp-9-/- are indicated with asterisks. In addition, the differences in mean diseases scores for all the data points from day 13 onwards till day 35 were significant for faslpr and mmp-9-/-/faslpr versus WT. Standard deviations from WT and MMP-9-/- are indicated. *p<0.05 versus WT by Kruskal-Wallis test with Dunn’s multiple comparison. (B) Incidence of the disease after EAE induction. (C) Averages of day-of-onset, percentages of the incidence and maximal disease scores. (mean ± SD).

