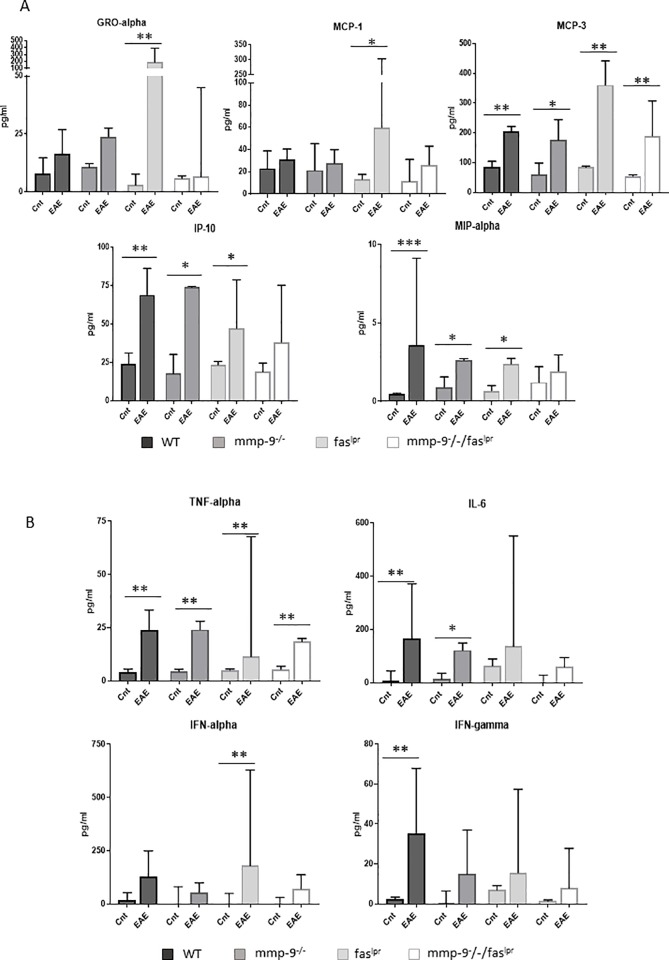
Fig 3.
Plasma chemokine and cytokine levels at 1 month after EAE induction. ELISA analysis of the indicated chemokines (A) and cytokines (B) from plasma samples obtained after 1 month in control animals (Cnt) and animals with EAE (EAE). The histograms represent the means (±SD) of each group. P values were determined by ANOVA Kruskal-Wallis test. *p<0.05, **p<0.01 and ***p<0.001 versus control 1 month. Control data were obtained from 3–4 mice. EAE data were obtained from 4–8 mice.

