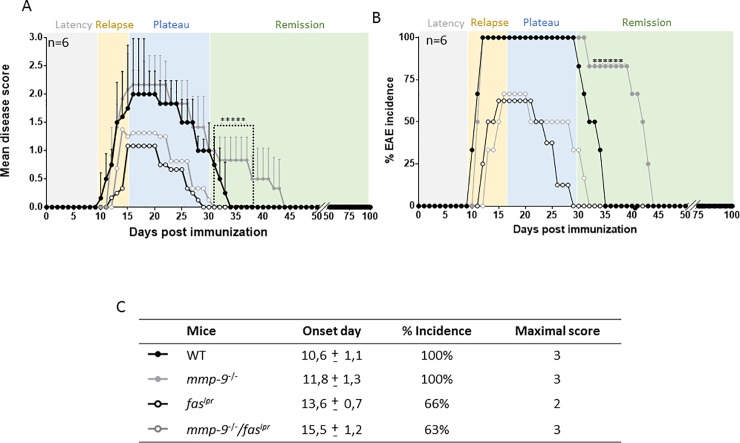
Fig 4.
Clinical follow-up of EAE in WT, mmp-9-/-, faslpr and mmp-9-/-/faslpr mice for 100 days. EAE was induced in groups (n = 6) of mice of the four different genotypes and disease scores were measured during 100 days. (A) Significant differences between WT and mmp-9-/- are indicated with asterisks. Means ± SD from WT and MMP-9-/- are indicated. *p<0.05 versus WT by Kruskal-Wallis test with Dunn’s multiple comparison. (B) Percentages of EAE incidence after the induction of the disease. (C) Average day-of-onset, percentage of incidence and maximal score. (mean±SD).

