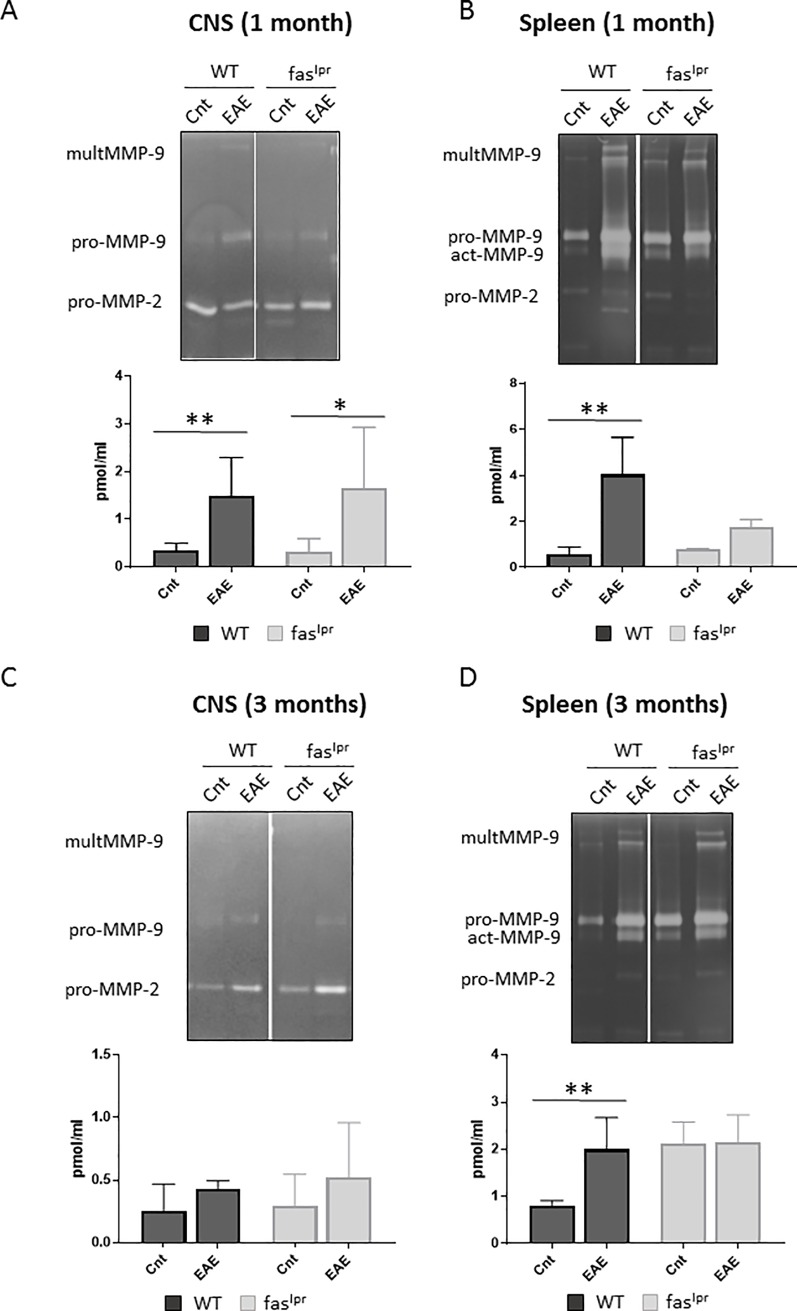
Fig 7.
MMP-9 upregulation in animals with EAE. Quantitative gelatin zymography analysis was used to analyze MMP-9 on tissue extracts from the central nervous system (CNS) (A) and spleens (B) after 1 month of EAE induction. Similar analyses were done at 3 months for CNS (C) and spleens (D). Volumes equivalent to 40 μl of tissue extracts were prepurified by gelatin-Sepharose. After purification, the samples were analyzed by gelatin zymography and the bands were quantified with the use of in-depth standardization. The histograms represent means ± SD of the quantification of MMP-9. P values were determined by ANOVA Kruskal-Wallis test. *p<0.05 and **p<0.01. Cnt 1m: Control at 1 month. 1m: EAE at 1 month. Cnt 3m: Control at 3 months. 3m: EAE at 3 months. Control data were obtained from 3–4 mice. EAE data were obtained from 4–8 mice.

