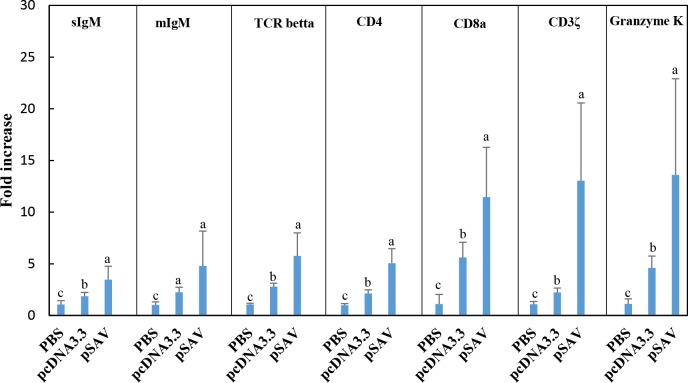
Fig 4. Expression of T- and B- cell marker genes in response to injection of plasmids measured by RT-qPCR.
Treatment groups and experimental details as described in Fig 2. Expression value of each gene was normalized against the levels of EF1αβ. Numbers represents fold increase in expression (mean ± SD) compared to the PBS group. Bars not sharing common letter indicate significant difference (p ≤ 0.05).

