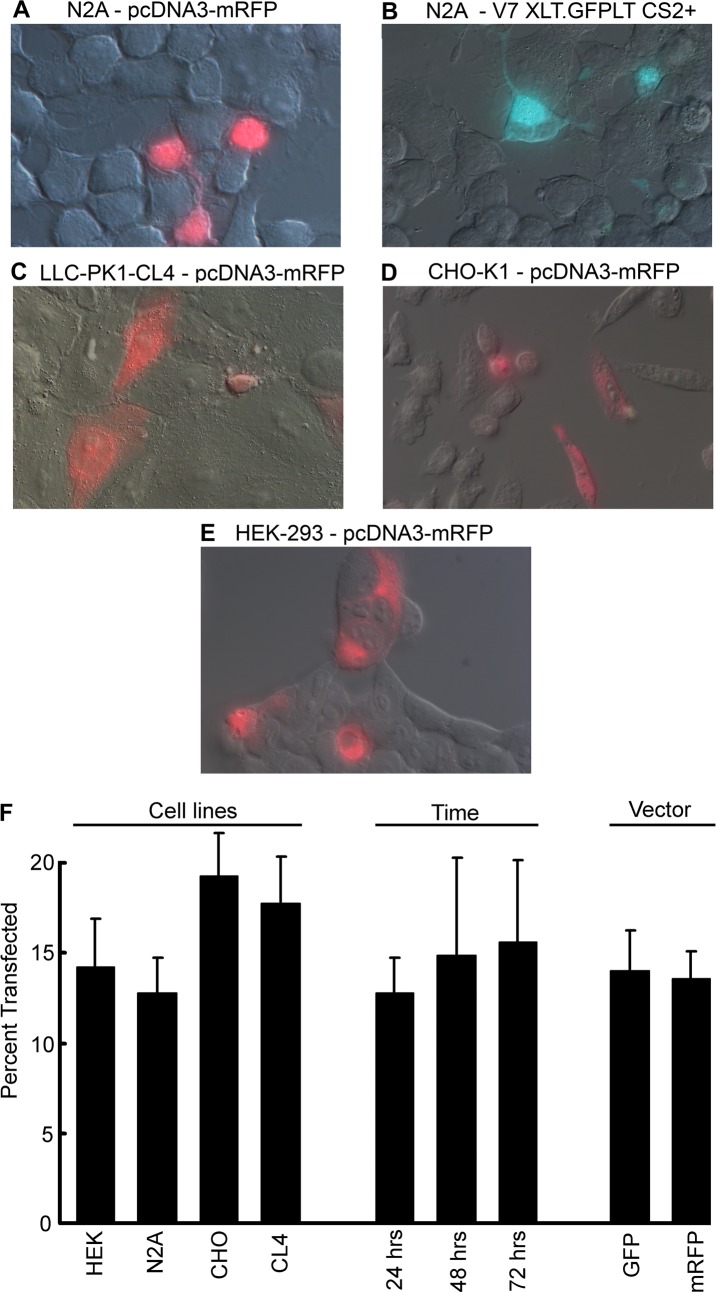
Fig 1.
Expresssion of pScop2 as a fusion construct with either GFP or mRFP as a reporter, in different mammalian cell lines (Panels A-E). Cells were examined 24 hours after transfection by lipofectamine. Nomarski and fluorescence images were overlaid. (F) Bar graph representing the efficiency of transfection, as determined from cell counts derived from multiple fields (error bars indicate SEM). The first group of bars compares the different cell lines (left); the middle group shows the percent transfected N2A cells at three time points (24, 48, and 72 hrs.). An overall comparison of the efficiency of the two vectors is displayed in the right portion of the graph.

