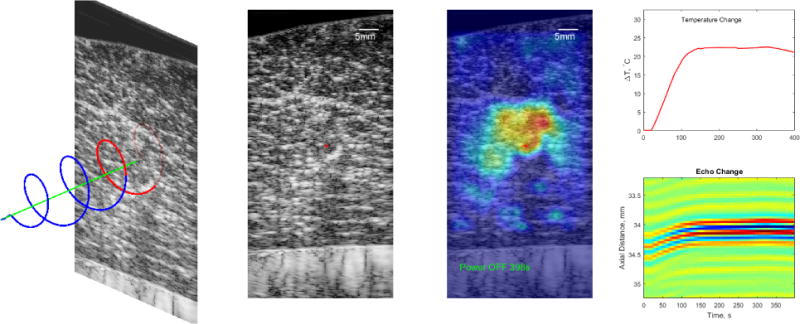
Fig. 2.

UST Monitoring of RF Heating in Bovine Muscle Ex Vivo. Left: Experiment setup showing the helical heating device and the position of the ultrasound imaging plane. Middle Left: A B-mode image of the target showing the inhomogeneous nature of the tissue. The “+” marker indicates the center of the heated region. Middle Right: The estimated 2D temperature profile overlaid on the B-mode image. Right: A temporal profile of the temperature change (top) at the “+” marker and a spatio-temporal representation of the echoes from 200 frames at the “+” marker.
