Fig. 1.

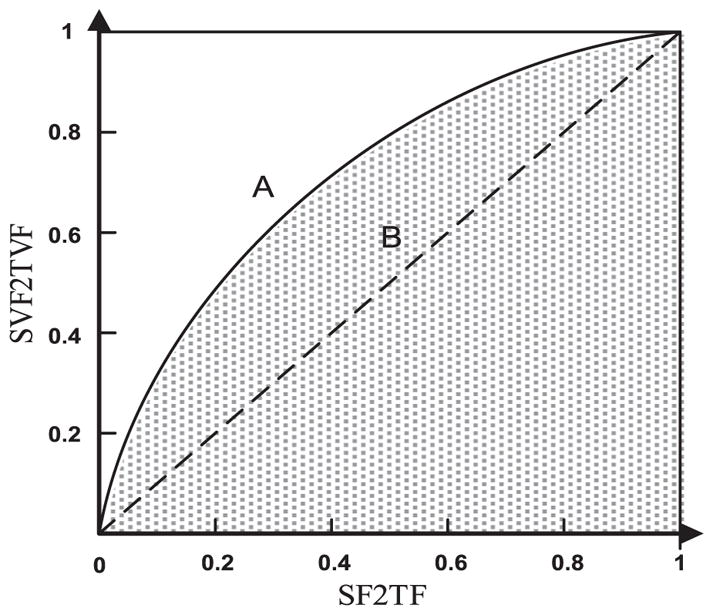
Illustration of Feature Selection Precision (FSP). x axis is selected-features-to-total-features ratio (SF2 TF) and y axis is selected-valid-features-tototal- valid-features ratio (SVF2TVF). The area under the curve is FSP.

Illustration of Feature Selection Precision (FSP). x axis is selected-features-to-total-features ratio (SF2 TF) and y axis is selected-valid-features-tototal- valid-features ratio (SVF2TVF). The area under the curve is FSP.