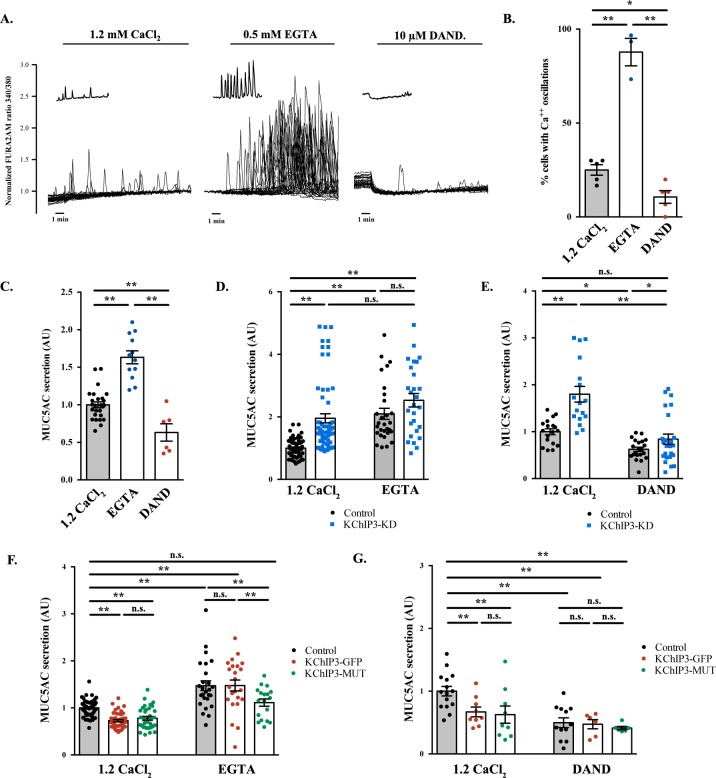
Figure 2. Ca2+ oscillations in goblet cells control KChIP3 function.
(A) Time course of Ca2+ responses (normalized FURA-2AM ratio) obtained in differentiated HT29-18N2 cells in resting conditions exposed to different extracellular buffers: 1.2 mM CaCl2 (left), 0.5 mM EGTA (center), or 10 µM dandrolene (right) (n = 30, inset shows a recording obtained from a single cell under each condition). (B) Percentage of cells oscillating in each condition during 10 min. Average values ± SEM are plotted as scatter plot with bar graph (N > 3) (black dots: 1.2 mM CaCl2, blue dots: EGTA, red dots: dandrolene). (C) Secreted MUC5AC collected from differentiated HT29-18N2 cells that were incubated for 30 min at 37°C with different buffers: 1.2 mM CaCl2 (black dots), 0.5 mM EGTA (blue dots) or 10 µM dandrolene (red dots). The y-axis represents relative values with respect to the values of control cells. Average values ± SEM are plotted as scatter plot with bar graph (N > 3). (D) Secreted MUC5AC from differentiated control (black circles) and KChIP3 stable knockdown cells (KChIP3-KD) (blue squares) collected after 30 min incubation at 37°C in the in the presence (1.2 mM CaCl2) or absence (0.5 mM EGTA) of extracellular Ca2+. Data were normalized to intracellular actin levels. The y-axis represents normalized values relative to the values of untreated control cells. (E) Secreted MUC5AC from control (black circles) and KChIP3 stable knockdown cells (KChIP3-KD) (blue squares) that were incubated for 30 min at 37°C with vehicle or 10 µM dandrolene (DAND) in the presence of extracellular Ca2+. Data were normalized to intracellular actin levels. The y-axis represents normalized values relative to the values of untreated control cells. (F) Secreted MUC5AC from differentiated control (black circles), KChIP3-GFP (red circles) and KChIP3-MUT (green circles) cells that were incubated for 30 min at 37°C in the in the presence (1.2 mM CaCl2) or absence (0.5 mM EGTA) of extracellular Ca2+. Data were normalized to intracellular actin levels. The y-axis represents normalized values relative to the values of untreated control cells. (G) Secreted MUC5AC from differentiated control (black circles), KChIP3-GFP (red circles) and KChIP3-MUT (green circles) cells after 30 min incubation at 37°C with vehicle or 10 µM dandrolene (DAND) in the presence of extracellular Ca2+. Data were normalized to intracellular actin levels. The y-axis represents normalized values relative to the values of untreated control cells. Abbreviations: EGTA: Buffer with 0.5 mM EGTA, DAND: 10 µM Dandrolene treatment. *p<0.05, **p<0.01, n.s.: not statistically significant.


