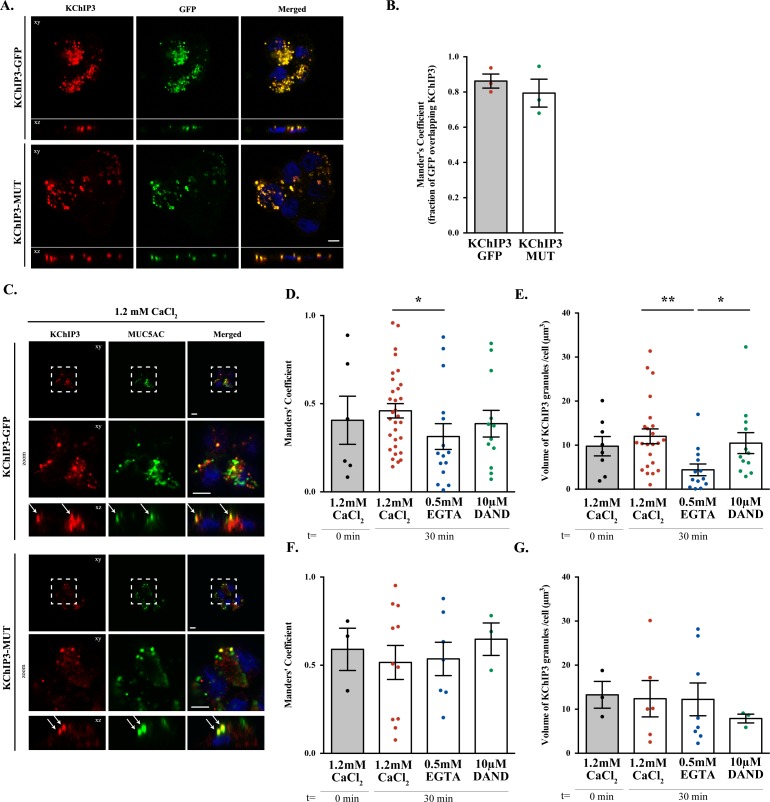
(A) Differentiated KChIP3-GFP and KChIP3-MUT cells were processed for cytosolic washout, fixed and permeabilized for analysis by immunofluorescence microscopy with an anti-KChIP3 (red), anti-GFP antibody (green) and DAPI (blue). Images represent a single plane (xy) and an orthogonal view of each channel (xz). Scale bar = 5 µm. (B) Colocalization between KChIP3 and GFP was calculated from immunofluorescence images by Manders’ coefficient using FIJI. Average values ± SEM are plotted as scatter plot with bar graph. The y-axis represents Manders’ coefficient of the fraction of GFP overlapping with KChIP3. (C) Differentiated KChIP3-GFP and KChIP3-MUT cells were processed for cytosolic washout at t = 0. After fixation and permeabilization, samples were analyzed by immunofluorescence microscopy with an anti-GFP (KChIP3, red), anti-MUC5AC antibody (MUC5AC, green) and DAPI (blue). Images represent a single plane (xy), a zoom of the area within the white square and an orthogonal view of each channel (xz). Scale bar = 5 µm. White arrows point to the colocalization between KChIP3 and MUC5AC. (D, F) Colocalization between KChIP3-GFP (D) or KChIP3-MUT (F) (anti-GFP) and MUC5AC at different conditions (t = 0’, t = 30’ 1.2 mM CaCl2, t = 30’ 0.5 mM EGTA, t = 30’ 10 µM DAND) was calculated from immunofluorescence images by Manders’ coefficient using FIJI. Average values ± SEM are plotted as scatter plot with bar graph. The y-axis represents Manders’ coefficient of the fraction of KChIP3 overlapping with MUC5AC. (E, G) Volume of KChIP3-GFP (E) or KChIP3-MUT (G) granules divided by the number of cells per field at different conditions (t = 0’, t = 30’ 1.2 mM CaCl2, t = 30’ 0.5 mM EGTA, t = 30’ 10 µM DAND). Volume was calculated using 3D objects counter from FIJI software. Abbreviations: EGTA: buffer with 0.5 mM EGTA, DAND: 10 µM Dandrolene treatment. *p<0.05.


