. 2018 Oct 1;7:e39729. doi: 10.7554/eLife.39729

Figure 4. Kcnip3-/- mice show increased mucus layer thickness.

(A, C) Representative distal colons of WT (left panel) and Kcnip3-/- (right panel) mice stained with PAS (A) or PAS-AB (C) at different magnification (2.5X, 10X and 40X). (B, D) Quantification of the mucus layer thickness in the distal colon stained with PAS (B) or PAS-AB (D) of WT (black dots) and Kcnip3-/- (blue dots) mice. Average values ± SEM are plotted as scatter plot with bar graph. The y-axis represents the thickness of the mucus layer in µm. Abbreviations: +/+: WT mice, -/-: Kcnip3-/- mice, ML: Mucus layer, GC: Goblet cell. *p<0.05.

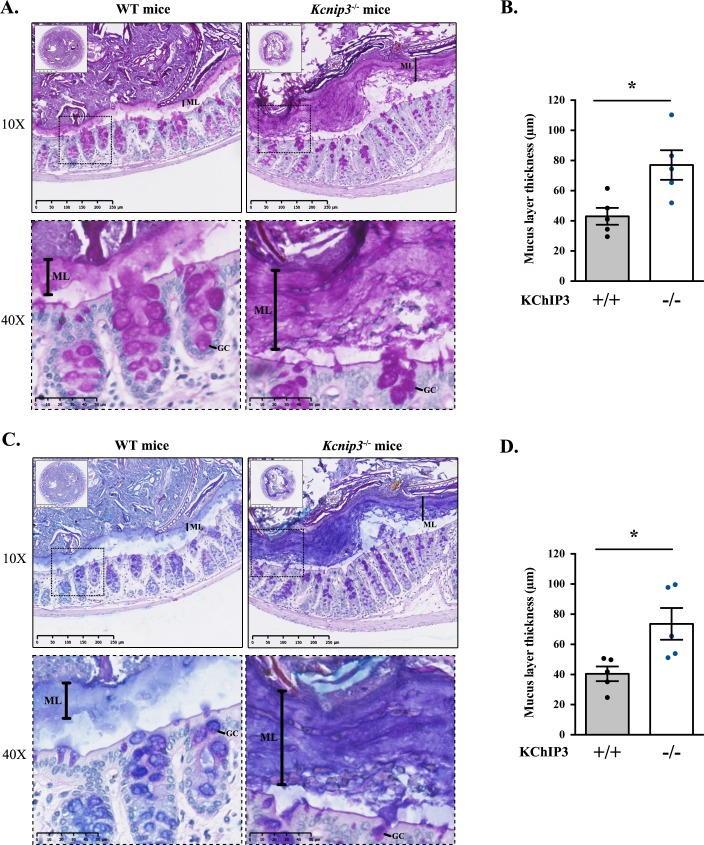
Figure 4.

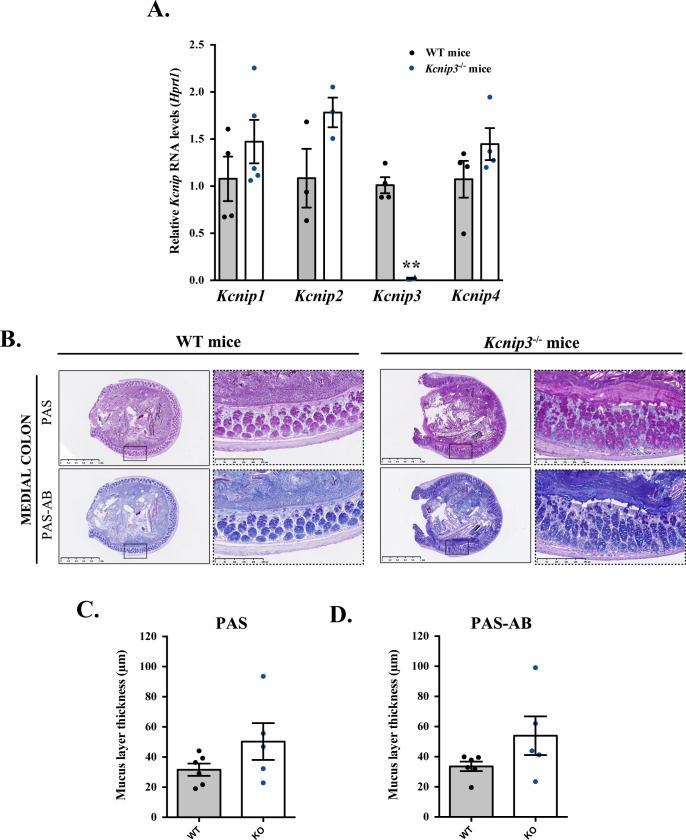
Figure 4—figure supplement 1. Kcnip3-/- mice show increased mucus layer at the medial colon.

Figure 4—figure supplement 1.

(A) Kcnip1 (KChIP1), Kcnip2 (KChIP2), Kcnip3 (KChIP3) and Kcnip4 (KChIP4) RNA levels were evaluated in the colon of both Kcnip3-/- and WT mice by quantitative real-time PCR and normalized to Hprt1 levels. mRNA levels of each gene are represented as relative value compared to WT mice. Results are average values ± SEM (N ≥ 3). (B) Representative medial colons of WT (left panel) and Kcnip3-/- (right panel) mice stained with PAS or PAS-AB at different magnification (2.5X and 10X). (C,D) Quantification of the mucus layer thickness in the distal colon stained with PAS (C) or PAS-AB (D) of WT (black dots) and Kcnip3-/- (blue dots) mice. Average values ± SEM are plotted as scatter plot with bar graph. The y-axis represents the thickness of the mucus layer in µm. Abbreviations: WT: WT mice, KO: Kcnip3-/- mice.