. 2018 Sep 11;7:e36428. doi: 10.7554/eLife.36428

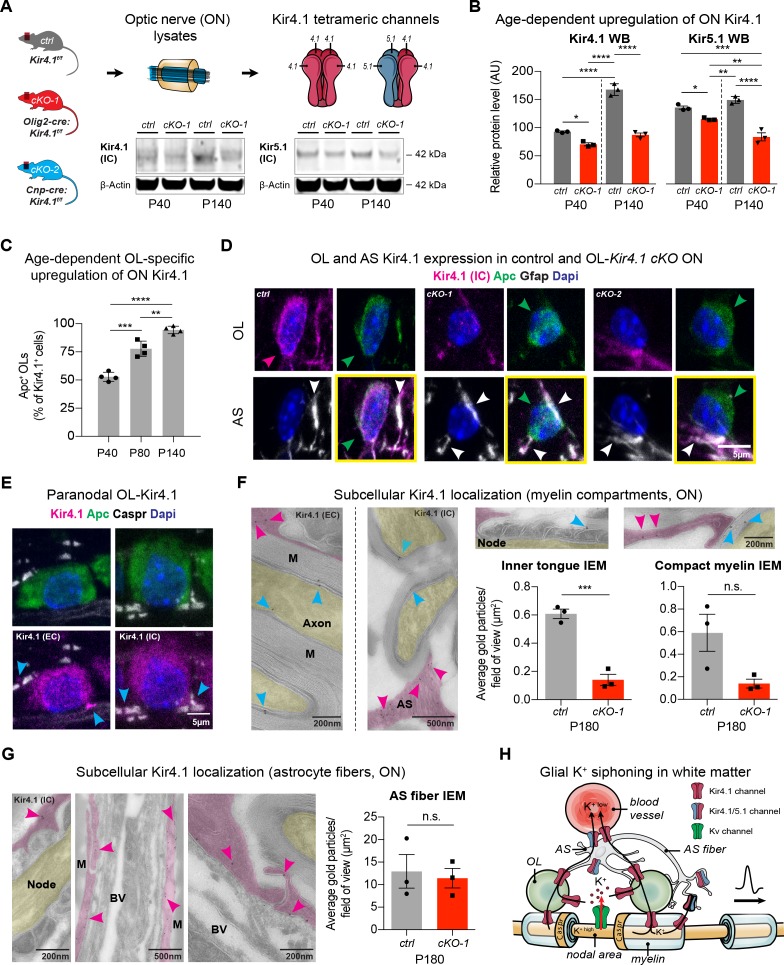
Figure 1. OL-Kir4.1 is upregulated during postnatal development and localized to peri-axonal spaces.

Kir4.1 ON protein levels were upregulated between age P40 and P140, whereas Kir5.1 protein levels did not change during aging (A–B). Note substantial loss of Kir4.1 protein in Olig2-cre driven Kcnj10 cKO (cKO-1) mice at P40, which became more apparent at P140; Kir5.1 protein was also reduced in cKO-1 ONs at P40 and P140 (control and cKO-1: n = 3 for all time points) (A–B). Quantification of Kir4.1+ Apc+ OLs confirmed age-dependent upregulation of OL-Kir4.1 channels between P40 and P140 (n = 4 for all time points) (C). One-way ANOVA with Tukey’s multiple comparison tests were performed in B and C; *p≤0.05, **p≤0.01, ***p≤0.001, ****p≤0.0001. Kir4.1 channels were lost from both ON OL cell bodies in cKO-1 and Cnp-cre driven Kcnj10 cKO (cKO-2) mice versus controls (D). Note that Kir4.1+ OL are marked by magenta-colored arrowhead; Apc+ OLs are indicated by green arrowheads. Note AS Kir4.1 immunoreactivity and contacts of Kir4.1+ AS fibers with OLs (white arrowheads). Merged images are shown in panels highlighted by yellow surroundings (D). Kir4.1 was strongly expressed in OLs along spinal fiber tracts; note that cyan-colored arrowheads mark juxta-axonal Kir4.1 IR (E). Kir4.1 immunogold electron microscopy (IEM) labeling revealed presence of gold particles at inner and outer myelin tongue (cyan-colored arrowheads) and within AS fibers (magenda-colored arrowheads) adjacent to myelin sheaths (M = myelin) and blood vessels (BV = blood vessel; ctrl: n = 3, cKO-1: n = 3; F–G). Axon structures are highlighted in yellow, AS fibers are highlighted in magenta. Note decrease in inner tongue (F) but not compact myelin (F) or AS fiber (G) IEM labeling in cKO-1 ON tissue versus controls. Cartoon highlights proposed mechanism of glial K+ siphoning from axons during saltatory conduction towards blood vessels via a network of axonal Kv and glial Kir4.1 channels (H). Mann-Whitney tests were performed in F–G; ***p≤0.001, p=0.06 (F, compact myelin IEM), p=0.74 (G, AS fiber IEM). Data are presented as mean ±s.e.m in B–C and F–G.

Figure 1.

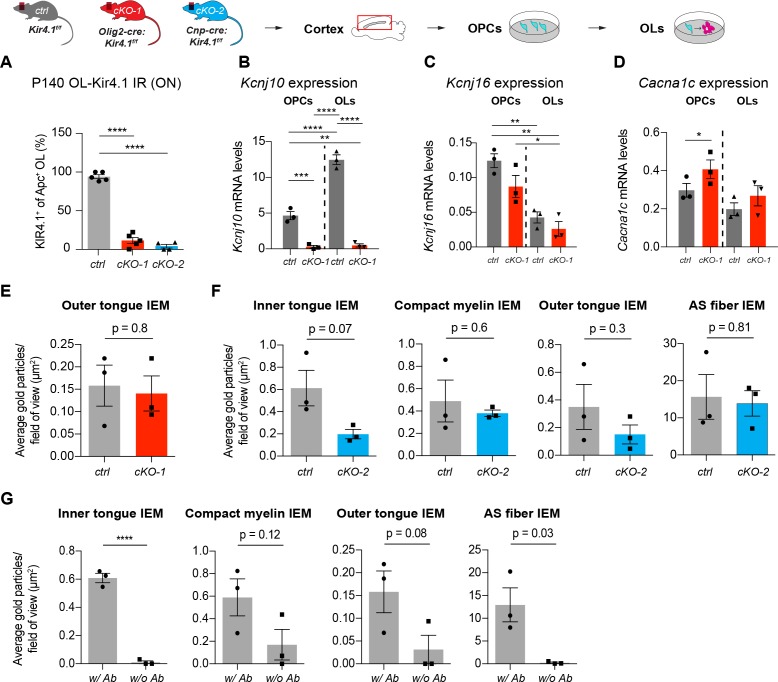
Figure 1—figure supplement 1. Validation of OL-encoded Kcnj10 cKO efficiency.

Figure 1—figure supplement 1.

Kir4.1 channels were efficiently ablated from ON OLs in cKO-1 (n = 5) and cKO-2 (n = 4) mice versus control ONs (n = 5; A). One-way ANOVA with Tukey’s multiple comparisons test was performed in A; ****p≤0.0001. Kcnj10 was upregulated during OL differentiation, and expression significantly suppressed in purified and immunopanned OPCs (ctrl: n = 3, cKO-1: n = 3) and OLs (ctrl: n = 3, cKO-1: n = 3) from cKO-1 mice (B). Conversely, Kcnj16 was not downregulated in OPCs (ctrl: n = 3, cKO-1: n = 3) and OLs (ctrl: n = 3, cKO-1: n = 3) from cKO-1 mice in vitro, however, note Kcnj16 downregulation during OPC-OL maturation (C). Cacna1c mRNA levels were increased in cultured OPCs (ctrl: n = 3, cKO-1: n = 3) but not OLs (ctrl: n = 3, cKO-1: n = 3) from cKO-1 mice suggesting a partial activation of Cav1.2 channels in OPCs (D). One-way ANOVA with Tukey’s multiple comparison tests were performed in B–D; *p≤0.05, **p≤0.01, ***p≤0.001, ****p≤0.0001. No difference in outer tongue Kir4.1 IEM labeling between controls and ON cKO-1 tissue (E). Trend towards decreased Kir4.1 IEM labeling in cKO-2 ON tissue as compared to controls with respect to myelin compartments but not AS fibers (F). Background IEM labeling without primary antibody confirmed specificity of Kir4.1 IEM antibody labeling of myelin compartments and astrocyte fibers (G). Mann-Whitney tests were performed in E–G; ****p≤0.0001, p=0.8 (E, outer tongue IEM), p=0.07 (F, inner tongue IEM), p=0.6 (F, compact myelin IEM), p=0.3 (F, outer tongue IEM), p=0.81 (F, AS fiber IEM), p=0.12 (G, compact myelin IEM), p=0.08 (G, outer tongue IEM), p=0.03 (G, AS fiber IEM). Data are presented as mean ±s.e.m in A–G.
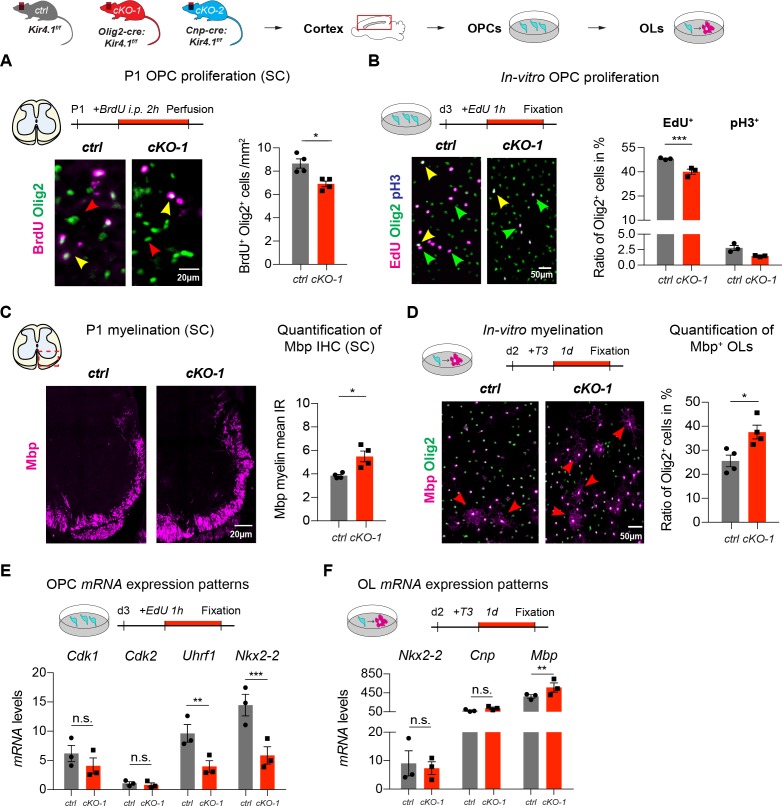
Figure 1—figure supplement 2. Early developmental changes in OL-encoded Kcnj10 loss-of-function.

Figure 1—figure supplement 2.

Kcnj10-deficient OPCs exhibited less BrdU incorporation in spinal cord tissue of P1 mice suggesting precocious exit from the cell cycle (ctrl: n = 4, cKO-1: n = 4; A). Likewise, purified and immunopanned Kcnj10-deficient OPCs exhibited less EdU incorporation but no difference in the mitosis marker phospho-histone H3 (pH3) in-vitro (ctrl: n = 3, cKO-1: n = 3; B). cKO-1 mice showed enhanced myelination in spinal cord WM at P1 by Mbp IHC (ctrl: n = 4, cKO-1: n = 4; C), and Kcnj10-deficient OLs showed more myelination during differentiating culture conditions in-vitro (ctrl: n = 4, cKO-1: n = 4; D). Mann-Whitney tests were performed in A–D; *p≤0.05, ***p≤0.001. Transcript levels for Cdk1 and Cdk2 were not different between control and Kcnj10-deficient OPCs in-vitro, whereas mRNA levels for Uhrf1 and Nkx2-2 were reduced in Kcnj10-deficient OPCs (ctrl: n = 3, cKO: n = 3; E). Note transcript levels for Nkx2-2 and Cnp were not different between control and Kcnj10-deficient OLs in-vitro after switching to differentiating culture conditions, however, Mbp mRNA levels increased in Kir4.1-deficient OPCs (ctrl: n = 3, cKO-1: n = 3; F). Multiple t tests were performed in E–F; **p≤0.01, ***p≤0.001; E: p=0.25 (Cdk1), p=0.88 (Cdk2) and F): p=0.97 (Nkx2-2), p=0.42 (Cnp). Data are presented as mean ±s.e.m in A–F.