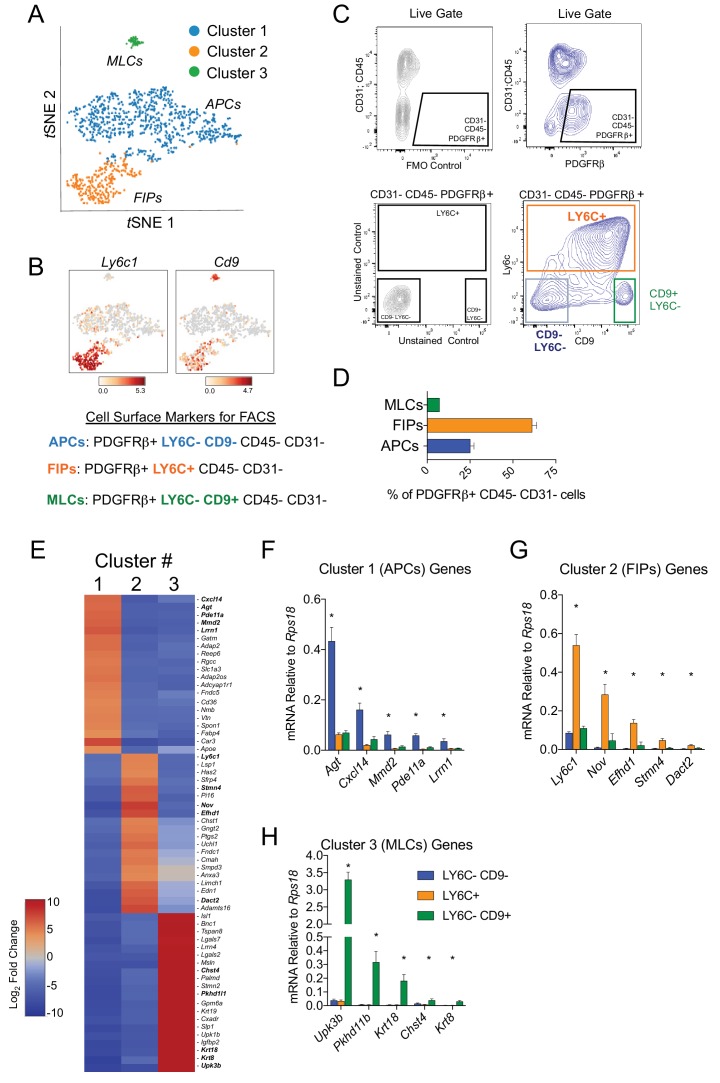
Figure 2. Isolation of gonadal WAT PDGFRβ+ subpopulations by FACS.
(A) tSNE plot of cells from Figure 1B with k-means = 3 clustering. See Figure 2—source data 1. (B) Distribution of Ly6c1 and Cd9 expression within tSNE plot. Transcript counts represent Log2 of gene expression. (C) Fluorescence-activated cell sorting (FACS) gating strategy to isolate indicated PDGFRβ+ CD31 CD45- subpopulations from gWAT. (D) Frequency of APCs, FIPs, and MLCs in gonadal WAT isolated from lean male 8 week old C57BL/6 mice. Frequencies were quantified based on the gating strategy shown in (C). n = 6. (E) Heatmap of top 20 most differentially expressed genes that define the clusters depicted in (A). See Figure 2—source data 1. (F) mRNA levels of Cluster 1 genes in freshly isolated APCs (LY6C- CD9-), FIPs (LY6C+), and MLCs (LY6C- CD9-), obtained from gWAT of lean male 8 week old C57BL/6 mice. n = 4. (G) mRNA levels of Cluster 2 genes in same sorted populations shown in (F). n = 4. (H) mRNA levels of Cluster 3 genes in same sorted populations shown in (F). n = 4. * in all graphs denote p<0.05 by student’s t-test in comparisons to the other populations. Bars represent mean +SEM.

