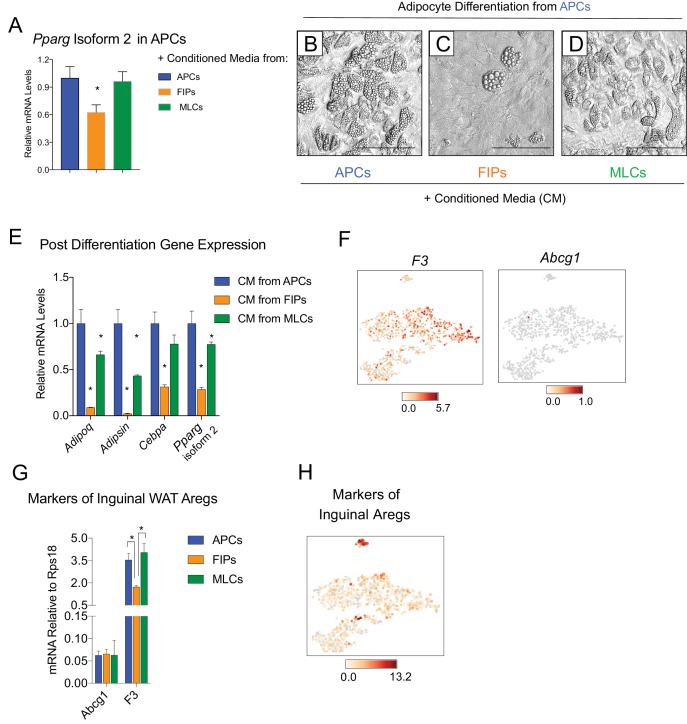
Figure 5. FIPs inhibit adipocyte differentiation from APCs.
(A) Pparg isoform two expression in cultured APCs maintained for 3 days in conditioned media from either APCs, FIPs, or MLCs. n = 4. *denotes p<0.05 by student’s t-test in comparisons to data represented in blue bars. Bars represent mean +SEM. (B) Brightfield image of APCs after 8 days of culture in conditioned media from parallel cultures of APCs. Scale bar = 100 μm for B-D. (C) Brightfield image of APCs after 8 days of culture in conditioned media from parallel cultures of FIPs. (D) Brightfield image of APCs after 8 days of culture in conditioned media from parallel cultures of MLCs. (E) mRNA levels of adipocyte-selective genes within cultures shown in (B–D). n = 3. * denotes p<0.05 by student’s t-test in comparisons to data represented in blue bars. Bars represent mean +SEM. (F) Distribution of Abcg1 and F3 expression within tSNE plot from Figure 1B. (G) mRNA levels of Abcg1 and F3 in APCs, FIPs, and MLCs isolated from lean 8 week old male mice. * denotes p<0.05 by student’s t-test. Bars represent mean +SEM. (H) tSNE-plot highlighting the potential relationship between APCs, FIPs, and MLCs, and iguinal WAT Aregs identified by Schwalie et al. (Schwalie et al., 2018). The top-23 Areg-selective genes identified by Schwalie et al were input into Cell Loupe Browser. Color intensities represent the sum of the Log2 expression values of the Areg selective gene list within the single cell RNA-sequencing dataset of gWAT from Figure 1B.

