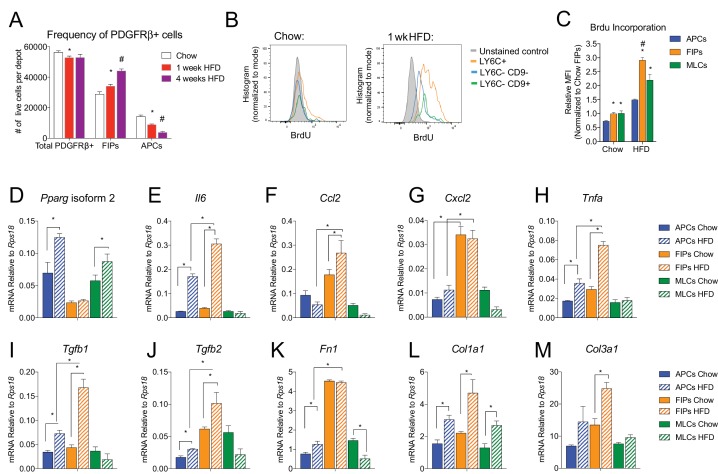
Figure 7. The frequencies and gene expression profiles of APCs and FIPs are differentially regulated in association with high-fat diet feeding.
(A) Frequency of total PDGFRβ+ cells, FIPs, and APCs in gonadal WAT isolated from chow-fed mice, mice fed high fat diet (HFD) for 1 week, or mice fed HFD for 4 weeks. n = 4. * denotes p<0.05 by student’s t-test in comparison to white bars. # denotes p<0.05 by student’s t-test in comparison to red or white bars. Bars represent mean +SEM. (B) Histograms depicting BrdU incorporation into APCs, FIPs, and MLCs after 1 week of chow or HFD feeding. (C) Relative median fluorescence intensity (MFI) corresponding to histograms shown in (B). n = 4. * denotes p<0.05 by student’s t-test in comparison to corresponding data from APCs. # denotes p<0.05 by student’s t-test in comparison to corresponding data from APCs and MLCs. (D) Pparg isoform two expression in freshly isolated APCs, FIPs, and MLCs, from gWAT of chow or 4 week HFD fed mice. n = 4. (E) Il6 expression in same cell populations shown in (D). (F) Ccl2 expression in same cell populations shown in (D). (G) Cxcl2 expression in same cell populations shown in (D). (H) Tnfa expression in same cell populations shown in (D). (I) Tgfb1 expression in same cell populations shown in (D). (J) Tgfb2 expression in same cell populations shown in (D). (K) Fn1 expression in same cell populations shown in (D). (L) Col1a1 expression in same cell populations shown in (D). (M) Col3a1 expression in same cell populations shown in (D). * in panels D-M denote p<0.05 by student’s t-test. All bars represent mean +SEM.

