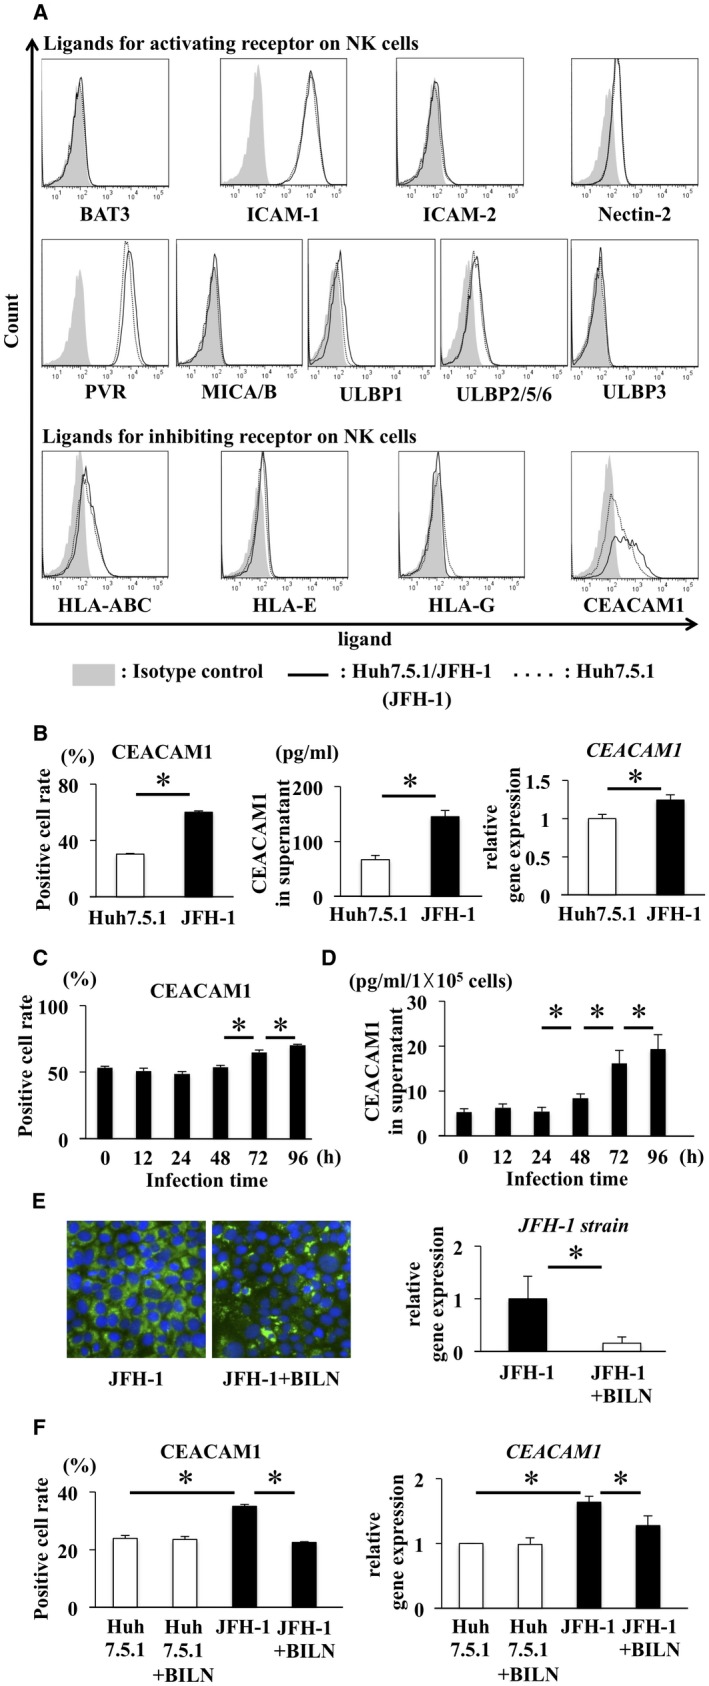
Figure 1.

CEACAM1 expression increased on Huh7.5.1 cells infected with JFH‐1 and decreased after treatment. (A) Expression of ligands for NK cells, such as BAT3, ICAM‐1, ICAM‐2, nectin‐2, PVR, MICA/B, ULBP1, ULBP2/5/6, ULBP3, HLA‐A, B, C, HLA‐E, HLA‐G and CEACAM1, was analyzed on Huh7.5.1 cells and Huh7.5.1 cells infected with JFH‐1 (Huh7.5.1/JFH‐1 cells). The dotted line represents Huh7.5.1 cells, the solid line represents Huh7.5.1/JFH‐1 cells, and the shaded area represents the isotype control. (B) CEACAM1 expression on Huh7.5.1 cells and Huh7.5.1/JFH‐1 cells was analyzed by flow cytometry (left panel, means ± SD, n = 4). CEACAM1 levels in the supernatants of Huh7.5.1 cells and Huh7.5.1/JFH‐1 cells were analyzed by ELISA (middle panel, means ± SD, n = 4). In addition, levels of the CEACAM1 mRNA in Huh7.5.1 cells and Huh7.5.1/JFH‐1 cells were analyzed by qRT‐PCR (right panel, means ± SD, n = 4). (C,D) CEACAM1 levels at the cell surface and in supernatants of Huh7.5.1/JFH‐1 cells were measured by flow cytometry and ELISA, respectively, at the indicated times after infection (means ± SD, n = 4). (E) Immunofluorescence staining for NS5A (green) and 4’,6‐diamidino‐2‐phenylindole (DAPI; blue) was performed in Huh7.5.1/JFH‐1 (left panel) cells and Huh7.5.1/JFH‐1 cells treated with BILN (right panel). Levels of JFH‐1 mRNA in Huh7.5.1/JFH‐1 cells before and after treatment were evaluated by qRT‐PCR (means ± SD, n = 4). (F) Analysis of Huh7.5.1 cells, Huh7.5.1 cells + BILN, Huh7.5.1/JFH‐1 cells, and Huh7.5.1/JFH‐1 cells + BILN. CEACAM1 expression on these cells was analyzed by flow cytometry (means ± SD, n = 4). Levels of CEACAM1 mRNA in these cells were evaluated by qRT‐PCR (means ± SD, n = 4). * P < 0.05.
