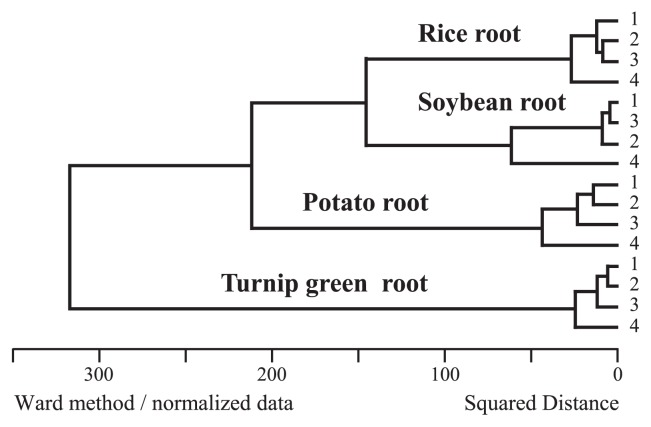
Fig. 4.
Cluster analysis of respective root–associated bacteria
The figure was created based on the NGS profiled in Fig. 3. Lanes 1, 2, 3, and 4 indicate the microbiomes prepared by modified 63f and 1492r, KU63f and KU1494r, KU64f and KU1494r, and KU68f and KU1494r, respectively.

