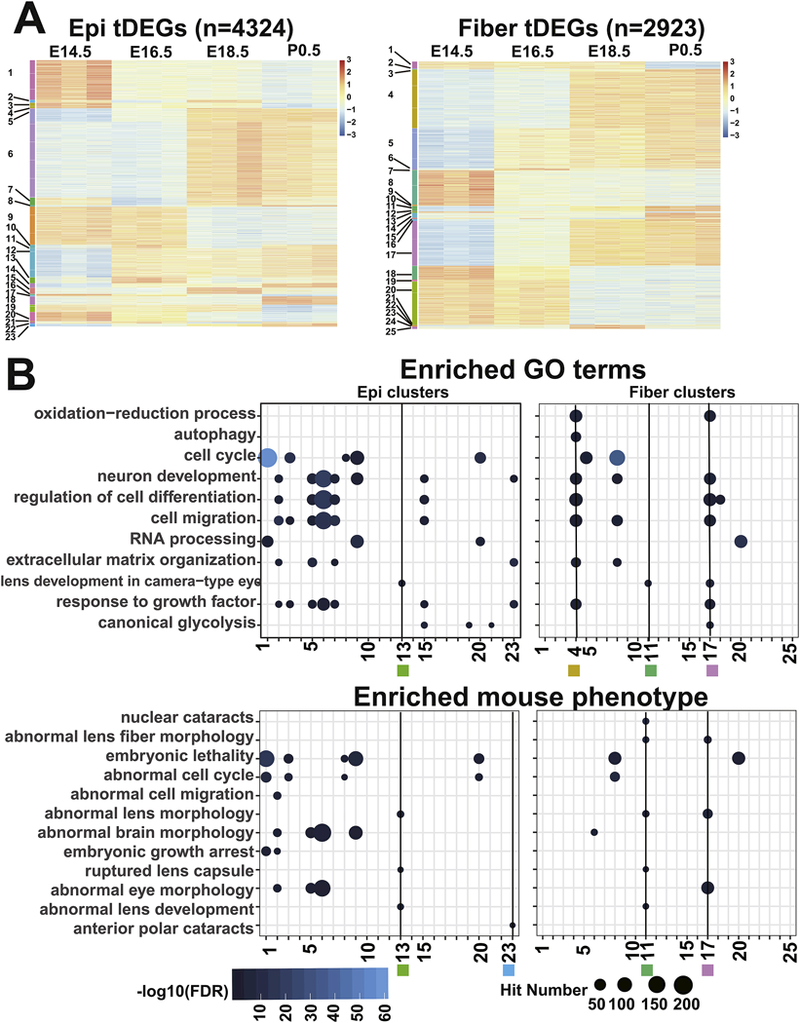
Fig. 3. Functional annotations for tDEG clusters.

A. The heatmap shows the expression patterns of the 23 epithelium clusters and 25 fiber clusters. Each row represents a gene. The color indicates scaled normalized RNA-seq read counts. B. The dot plot shows enriched GO terms and mouse phenotypes for individual clusters. The terms were first divided into fiber and epithelium enriched and then ranked by their adjusted p values. The blue color corresponds to -log10(FDR) and the dot size corresponds to the number of genes in the GO terms or mouse phenotypes. Black lines with labeled numbers and squares indicate the highlighted clusters.
