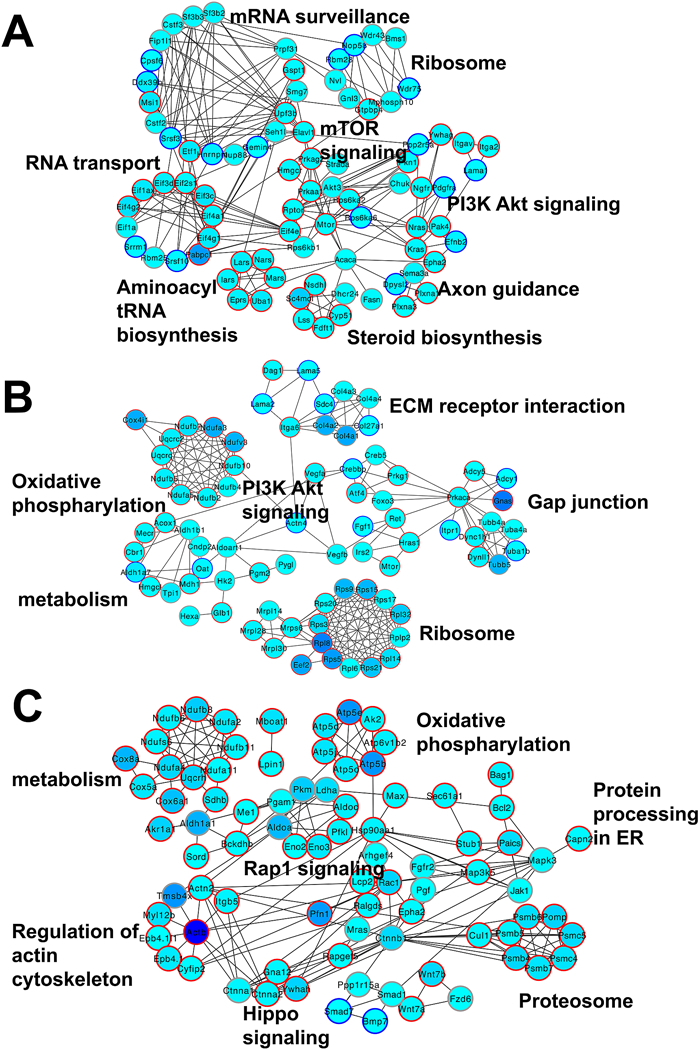
Fig. 5. Functional interaction of mTOR signaling with genes in the selected tDEG clusters.

A. The epithelium cluster 9 genes link mTOR signaling to 7 pathways. B. The fiber cell cluster 4 genes link Mtor to 6 pathways. C. The fiber cluster 17 genes show interactions of 7 signaling pathways. The filling color indicates the maximum FPKM of the genes of all time points in either epithelium or fiber. The red circle indicates fiber higher expressed genes. The blue circle indicates epithelium higher expressed genes. The grey circle indicates nondifferentially expressed genes.
