
Figure 1.
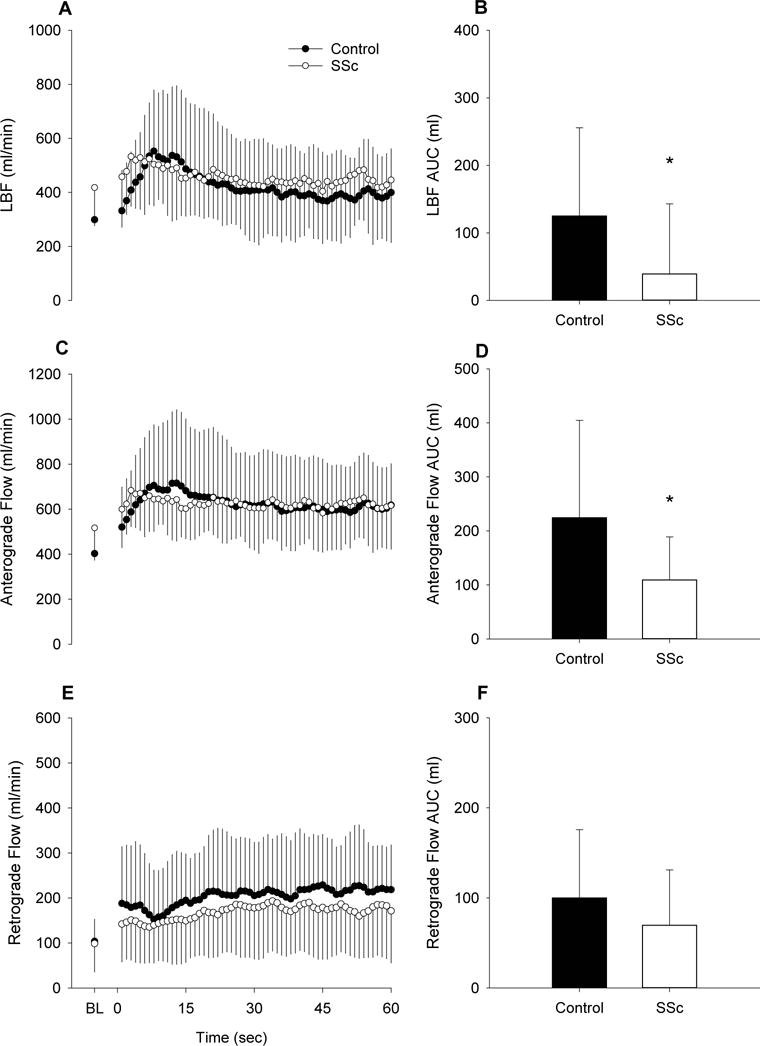
Leg blood flow (LBF) responses to passive leg movement (PLM) in patients with systemic sclerosis (SSc) and healthy controls. A, second-by-second tracing of LBF (ml/min) at baseline (BL) and for 1 min of PLM. B, LBF area under the curve (AUC) (ml) for 1 min. C, second-by-second tracing of anterograde (Ant) LBF (ml/min) at BL and for 1 min of PLM. D, Ant LBF AUC (ml) for 1 min. E, second-by-second tracing of retrograde (Ret) LBF (ml/min) at BL and for 1 min of PLM. F, Ret LBF AUC (ml) for 1 min. Control, n=17; SSc, n=12. * Significantly different from control, p<0.05. Values are mean ± SD.