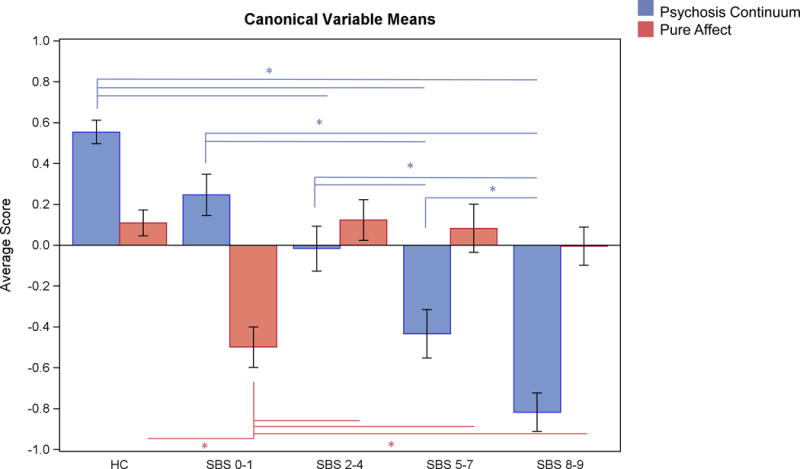
Figure 2. Group Differences in CDA Variables.

Bars show SBS group means (SE) on the significant canonical variables from the CDA. The first canonical variable (blue bars) best distinguishes groups along a psychosis continuum (nonaffective cases lowest scores, affective cases higher scores), whereas the second canonical variable (red bars) distinguishes more affective cases from all other groups. Lines and asterisks represent significant pair-wise comparisons using Tukey’s HSD.
