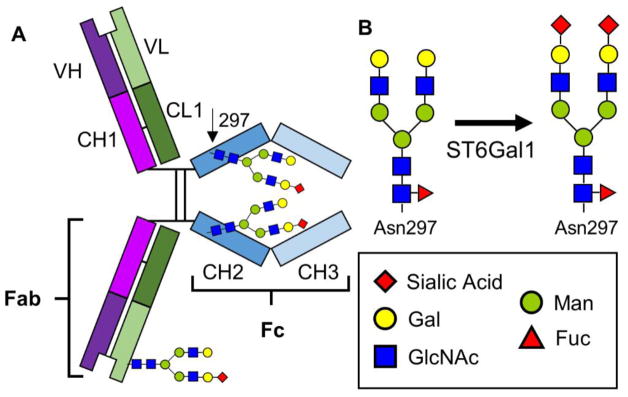
Figure 1. Visualization of IgG glycosylation.
A) Schematic of sites of glycosylation on IgG, either in the Fab region or in the Fc portion at the conserved Asn297 residue. B) N-glycan structures showing the action of ST6Gal1 converting galactosylated forms to fully sialylated forms. The key shows symbolic names for each monosaccharide.

