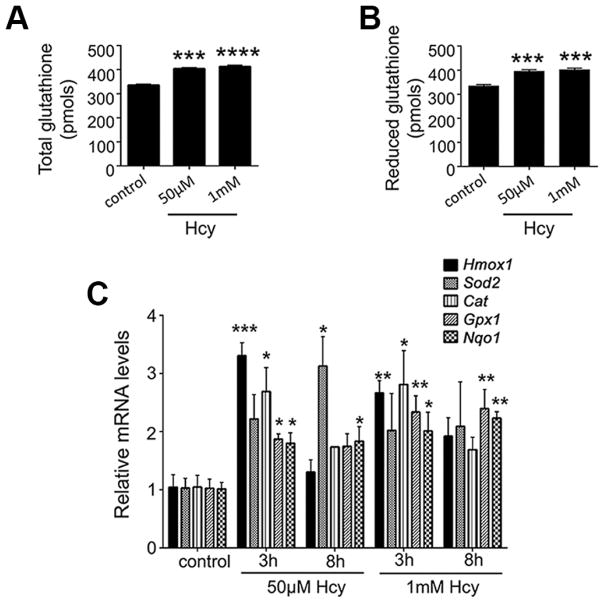
Fig 3. Assessment of glutathione and antioxidant genes in Müller cells exposed to Hhcy.
Glutathione levels were detected in primary Müller cells exposed to 50μM or1mM Hcy for 24h as described in the text. Levels are shown for (A) total GSH, and (B) reduced GSH. n=3, ***p<0.001, ****p<0.0001. (C) Expression of genes encoding several antioxidant proteins was analyzed by qRT-PCR in primary Müller cells exposed to 50μM or 1mM Hcy for 3h or 8h. n=3, *p<0.05, **p<0.01, ***p<0.001. (D’Agostino and Pearson Omnibus Normality test; data were normally distributed and were analyzed by one-way ANOVA and Dunnett’s post-hoc test).

