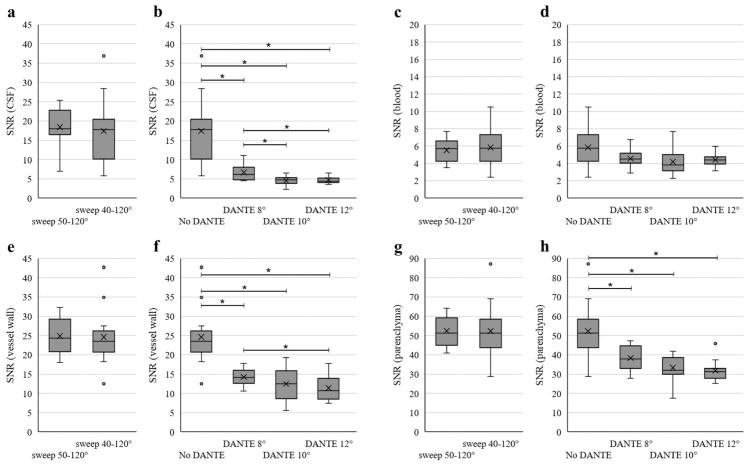
Figure 4.
Box plots show mean (X) and distribution of data points for SNR of the CSF (a, b), SNR of the blood (c, d), SNR of the vessel wall measured in the basilar artery (e, f), and SNR of the parenchyma measured in the pons (g, h). The central line represents the median, the X the mean, the lower and upper margins of the box the 25–75th percentile, and the whiskers all data excluding outliers. The vertical axis scale is different for the blood and parenchyma plots compared to the other SNR plots to better show the distribution of data. Statistical comparisons were performed separately for the no DANTE sweep 50°–120° versus sweep 40°–120° acquisitions (a, c, e, g) and then among the no DANTE sweep 40°–120° and the DANTE acquisitions (b, d, f, h). No significant difference was found between the no DANTE sweep 50°–120° versus sweep 40°–120° for any of the measures (p<0.05). * indicates significance with multiple comparisons (p<0.008) for the no DANTE vs DANTE comparisons.

