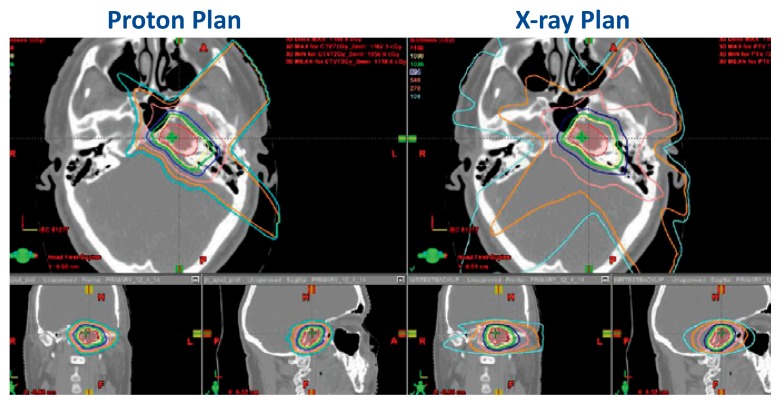
Figure 3.
This figure shows a dosimetric plan comparison for PBT versus x-rays. The red shaded area represents the tumor volume of a chondrosarcoma located in the base of skull. The yellow line in both images represents the prescription dose. The other colored lines represent successive decreasing radiation doses that irradiate normal tissues. In this example, the proton beam plan (left) is more conformal to the shape of the tumor and is able to avoid radiation dose to the eyes and brain compared to the x-ray plan.

