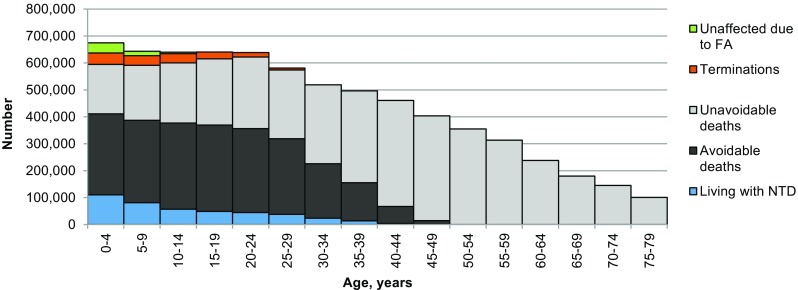
Fig. 7.

Estimated distribution of outcomes for spina bifida in 2010. The total outline shows the number of individuals who would be living with spina bifida if survival equalled the population norm, according to age in 2010 (6.98 million). The outline reflects the age distribution of the world population in 2010. The green fill shows cases avoided by folic acid food fortification (only 56,000 in 2010 because fortification only started to become policy in the late 1990s). The orange fill shows cases avoided by termination of pregnancy (196,000 in 2010). The grey fill shows deaths that would have occurred even with best care available when the affected person was born (unavoidable deaths). The great majority of deaths occurred soon after birth, but they appear in all age groups because the chart shows all outcomes. The black fill shows the numbers of deaths that occurred because of lack of access to available care (avoidable deaths) (total losses from the current world population due to spina bifida = 6.35 million). The blue fill shows estimated numbers living with spina bifida in 2010 (399,000)
