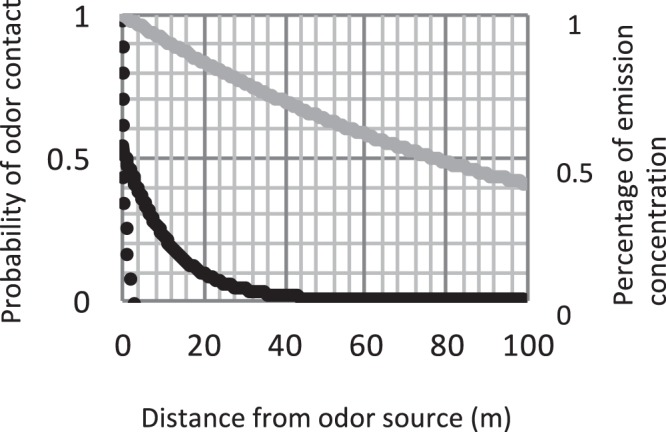
Figure 3.

The black lines represent the relationship between distance from flower (odor source) and the likelihood of plume contact, with the solid line representing a ‘high’ probability derived from Murlis et al.64 and the dashed line representing a ‘low’ probability derived from Riffell et al.67. The grey line is an estimated fit derived from McFrederick et al.’s48 calculations on distance travelled by floral odorants, represented by percent of emission concentration. By these calculations common floral odorants do not drop below 80% of original concentration until 25 m from source, indicating the odor probabilities used in this model are quite conservative. Additionally, comparing the concentration decay with the model’s odor probabilities indicates that when bumblebees have a 10% probability of plume contact, that plume is still at >80% original concentration, thus that plume is likely physiologically salient.
